Fig. 14
Download original image
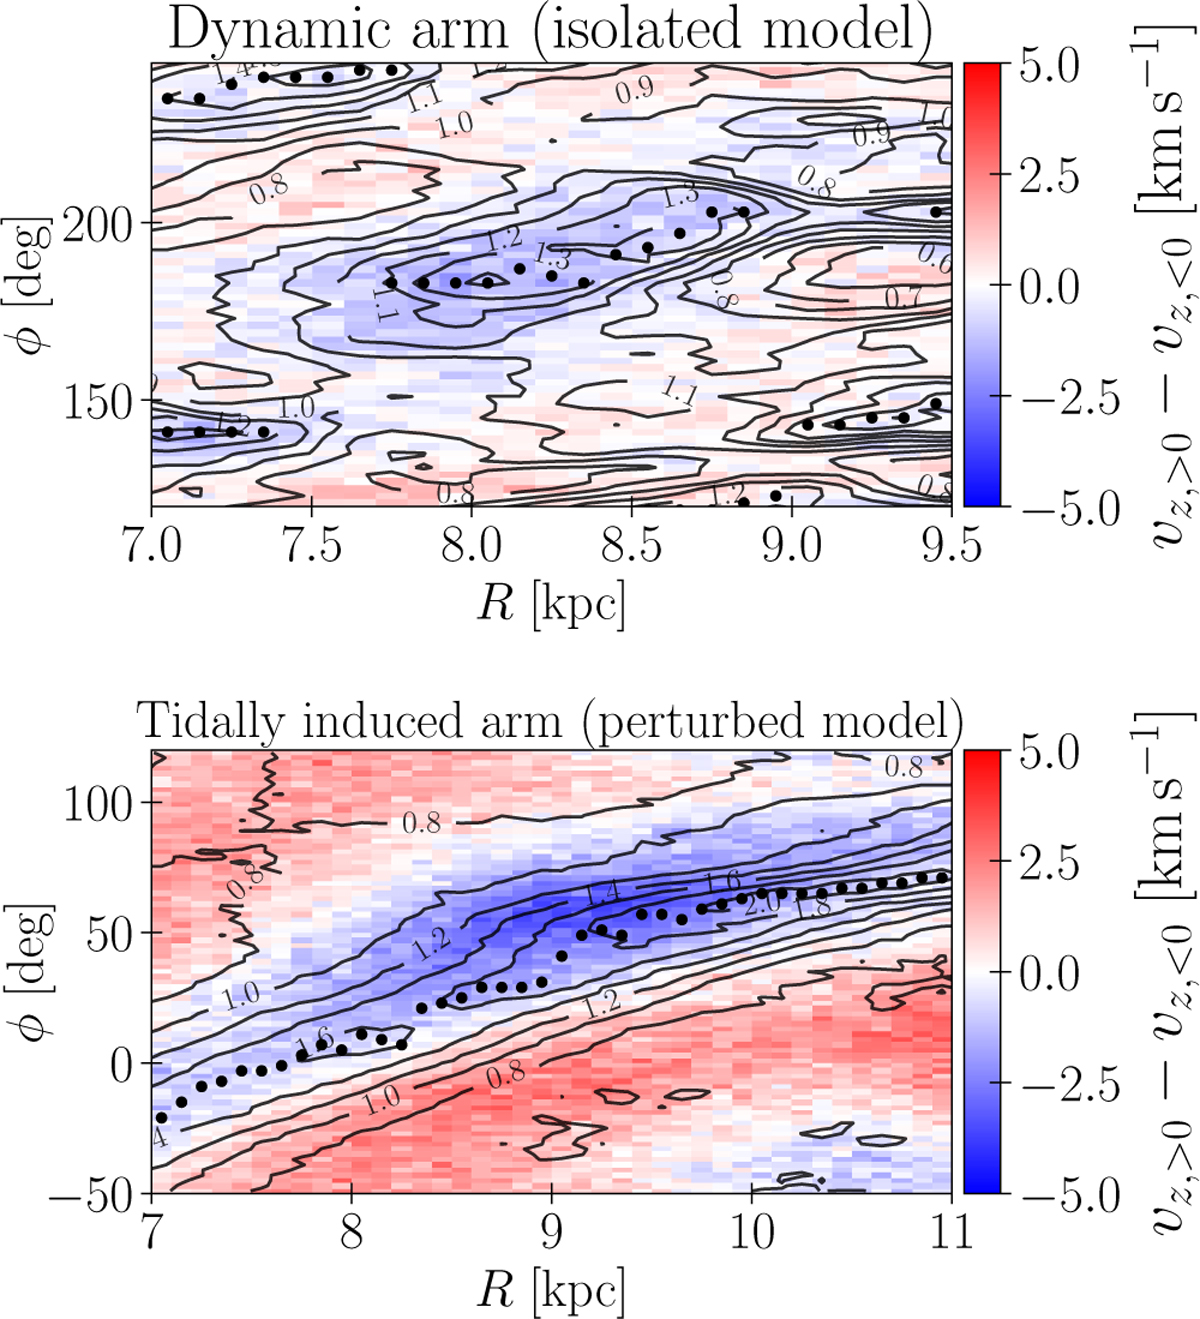
Breathing signature around spiral arms. Upper panel: breathing signature in the isolated model. Colour map shows the breathing velocity, vz, > 0−vz, > 0. Contours indicate the normalised density, Σ(R, ϕ)/Σ0(R). Black dots indicate the density peaks. Lower panel: same as the upper panel but in the perturbed model. In the perturbed model (tidally induced arms), the breathing velocity minimum is displaced from the density peak to the trailing side, unlike in the isolated model (dynamic arms) where they are aligned.
Current usage metrics show cumulative count of Article Views (full-text article views including HTML views, PDF and ePub downloads, according to the available data) and Abstracts Views on Vision4Press platform.
Data correspond to usage on the plateform after 2015. The current usage metrics is available 48-96 hours after online publication and is updated daily on week days.
Initial download of the metrics may take a while.