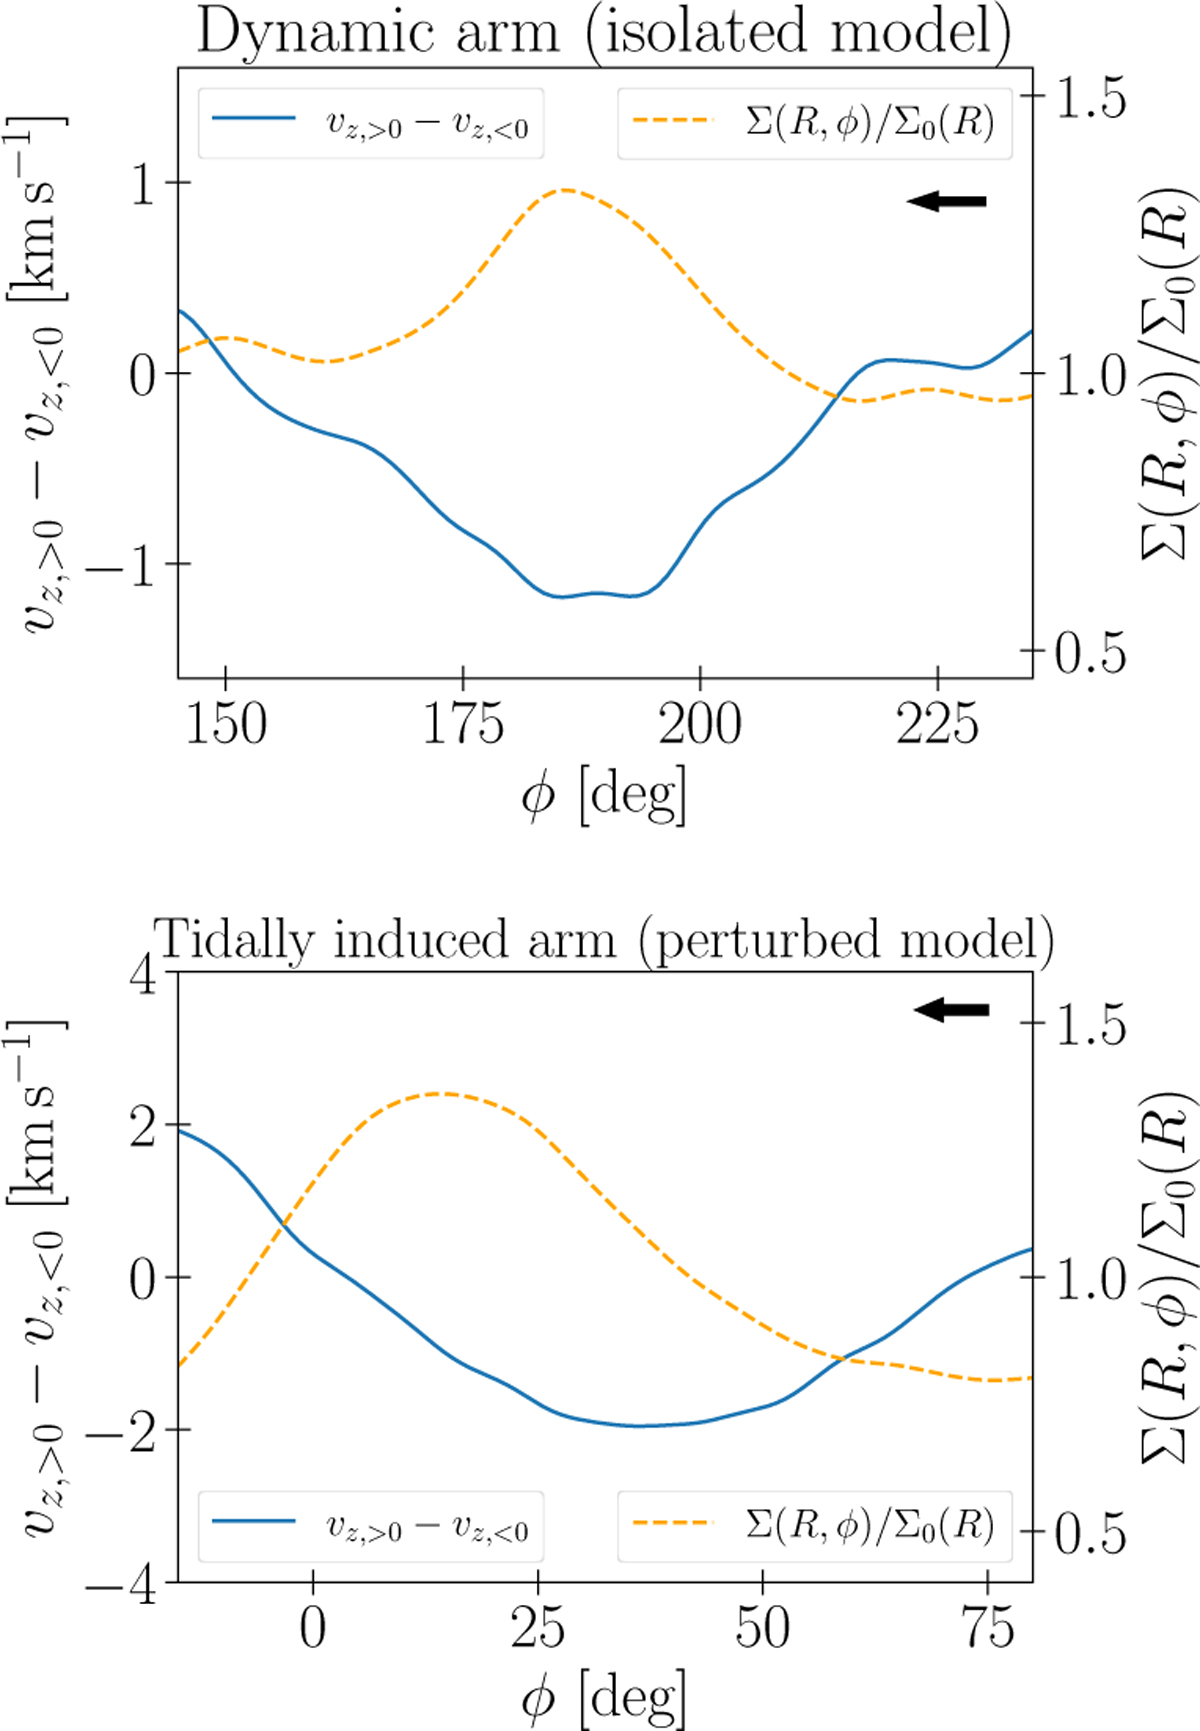
Fig. 15
Download original image
Breathing velocity and normalised density as functions of the azimuth. Upper panel: isolated model. The solid line and dashed line represent the breathing velocity and the normalised density, respectively, averaged over R between R = 8 kpc and 8.5 kpc. The arrow indicates the direction of the galaxy rotation. Lower panel: same as the upper panel but in the perturbed model. This plot quantifies the displacement in Fig. 14, showing that the breathing velocity minimum is shifted to the trailing side relative to the density peak in the perturbed model with tidally induced arms. This contrasts with the alignment seen in the isolated model with dynamic arms.
Current usage metrics show cumulative count of Article Views (full-text article views including HTML views, PDF and ePub downloads, according to the available data) and Abstracts Views on Vision4Press platform.
Data correspond to usage on the plateform after 2015. The current usage metrics is available 48-96 hours after online publication and is updated daily on week days.
Initial download of the metrics may take a while.