Fig. 2
Download original image
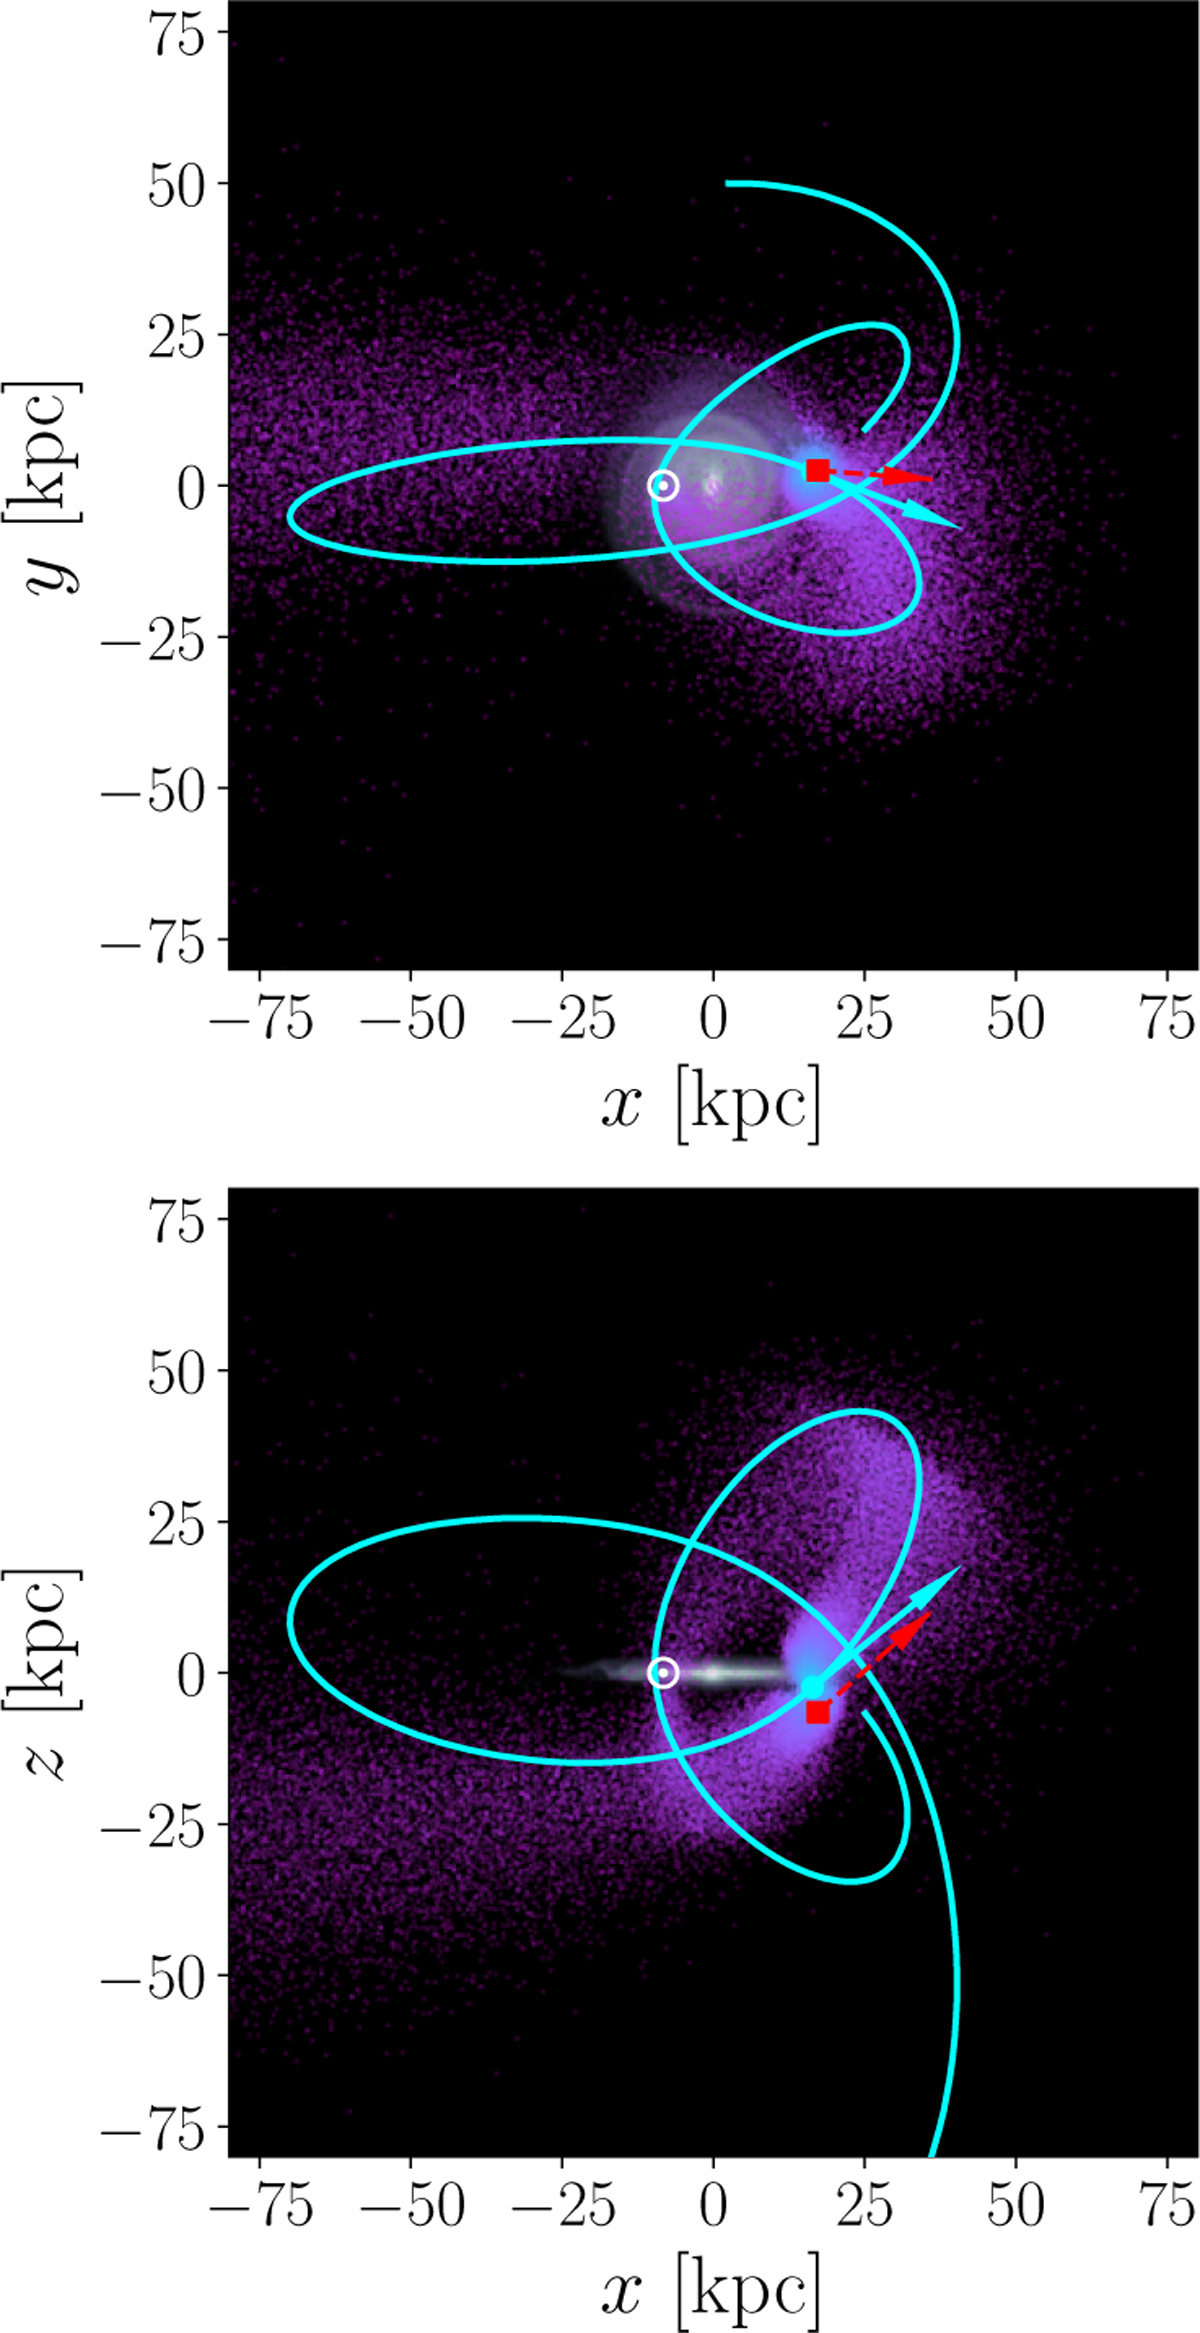
Projection of the dwarf’s orbit in the x–y plane (upper panel) and in the x–z plane (lower panel). The cyan line indicates the orbital trajectory of the dwarf. The cyan point and cyan solid arrow indicate the dwarf’s position and velocity at t = 1.78 Gyr, respectively. The red square and red dashed arrow indicate those for the Sgr at the present day estimated by Vasiliev & Belokurov (2020). Purple dots show the distribution of the stellar particles stripped away from the dwarf. The surface density of the host disc and the solar position are displayed on the background. The dwarf follows a nearly polar orbit similar to the Sgr, leaving a stellar stream of stripped particles along its orbital path.
Current usage metrics show cumulative count of Article Views (full-text article views including HTML views, PDF and ePub downloads, according to the available data) and Abstracts Views on Vision4Press platform.
Data correspond to usage on the plateform after 2015. The current usage metrics is available 48-96 hours after online publication and is updated daily on week days.
Initial download of the metrics may take a while.