Fig. 6
Download original image
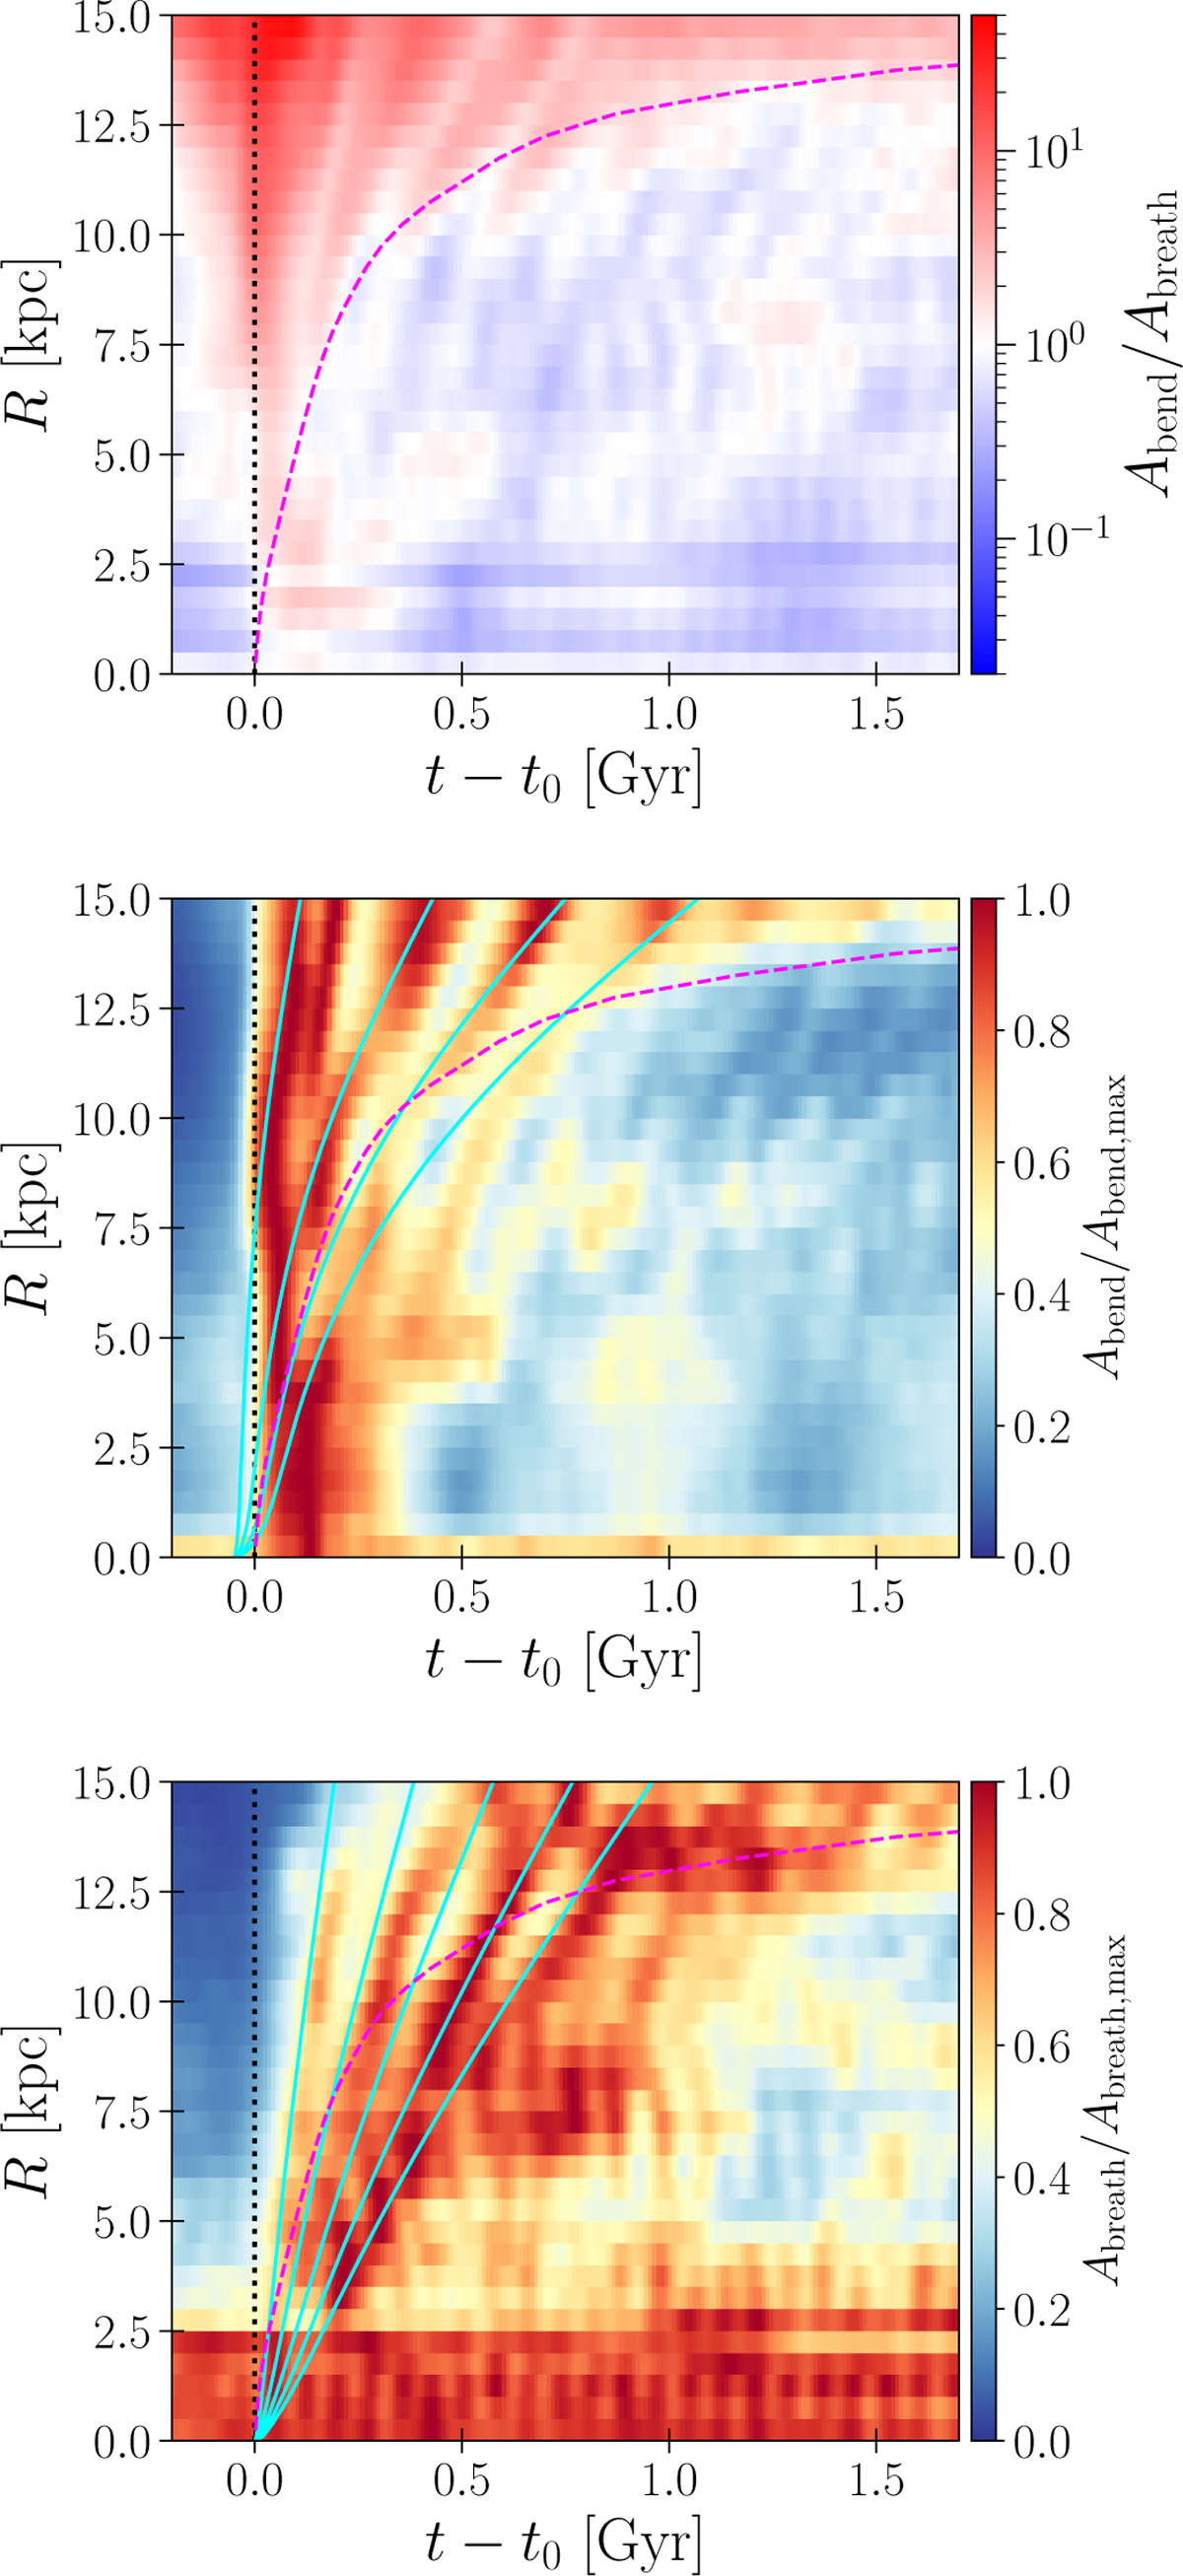
Evolution of the bending mode and the breathing mode in the single-impact model. First panel: bending and breathing amplitude ratio as a faction of time and the galactocentric radius. The horizontal axis indicates the time since the pericentre passage of the dwarf. A vertical dotted line indicates the pericentre time t–t0 = 0. Dashed curve represents R/σR(R). Second panel: bending amplitude as a function of time and the galactocentric radius. The amplitude is normalised by the maximum amplitude at each radius. Solid curves represent (1, 3, 5, 7) × π/v(R)−50 Myr. Third panel: same as the second panel but for the breathing mode. Solid lines represent (1, 2, 3, 4) × π/Ω(R). The bending mode decays rapidly due to horizontal mixing, while the breathing mode persists longer, driven by spiral arms. This difference of the two modes causes a transition to breathing dominance over time on the timescale of horizontal mixing (R/σR).
Current usage metrics show cumulative count of Article Views (full-text article views including HTML views, PDF and ePub downloads, according to the available data) and Abstracts Views on Vision4Press platform.
Data correspond to usage on the plateform after 2015. The current usage metrics is available 48-96 hours after online publication and is updated daily on week days.
Initial download of the metrics may take a while.