Fig. 7
Download original image
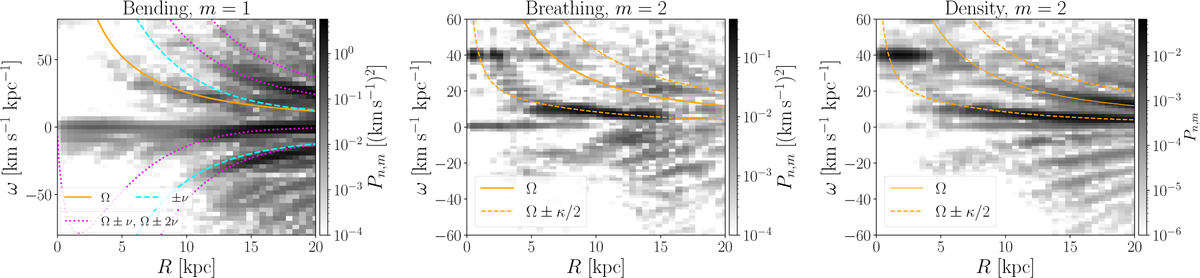
First panel: spectrogram of the m = 1 bending mode. Lines indicate characteristic frequencies: Ω (solid), ± v (dashed), Ω ± v, and Ω ± 2 v (dotted). Second panel: spectrogram of the m = 2 breathing mode. Solid and dashed lines indicate Ω and Ω ± κ/2, respectively. Third panel: spectrogram of the surface m = 2 density wave. Solid and dashed lines indicate Ω and Ω ± κ/2, respectively. The bending mode shows distinct branches aligned with the resonant curves of Ω ± v and Ω−2 v. The breathing mode and the density wave rotate at nearly the same pattern speeds, suggesting that the breathing mode is excited by the bar and the tidally induced arms.
Current usage metrics show cumulative count of Article Views (full-text article views including HTML views, PDF and ePub downloads, according to the available data) and Abstracts Views on Vision4Press platform.
Data correspond to usage on the plateform after 2015. The current usage metrics is available 48-96 hours after online publication and is updated daily on week days.
Initial download of the metrics may take a while.