Open Access
Fig. 4.
Download original image
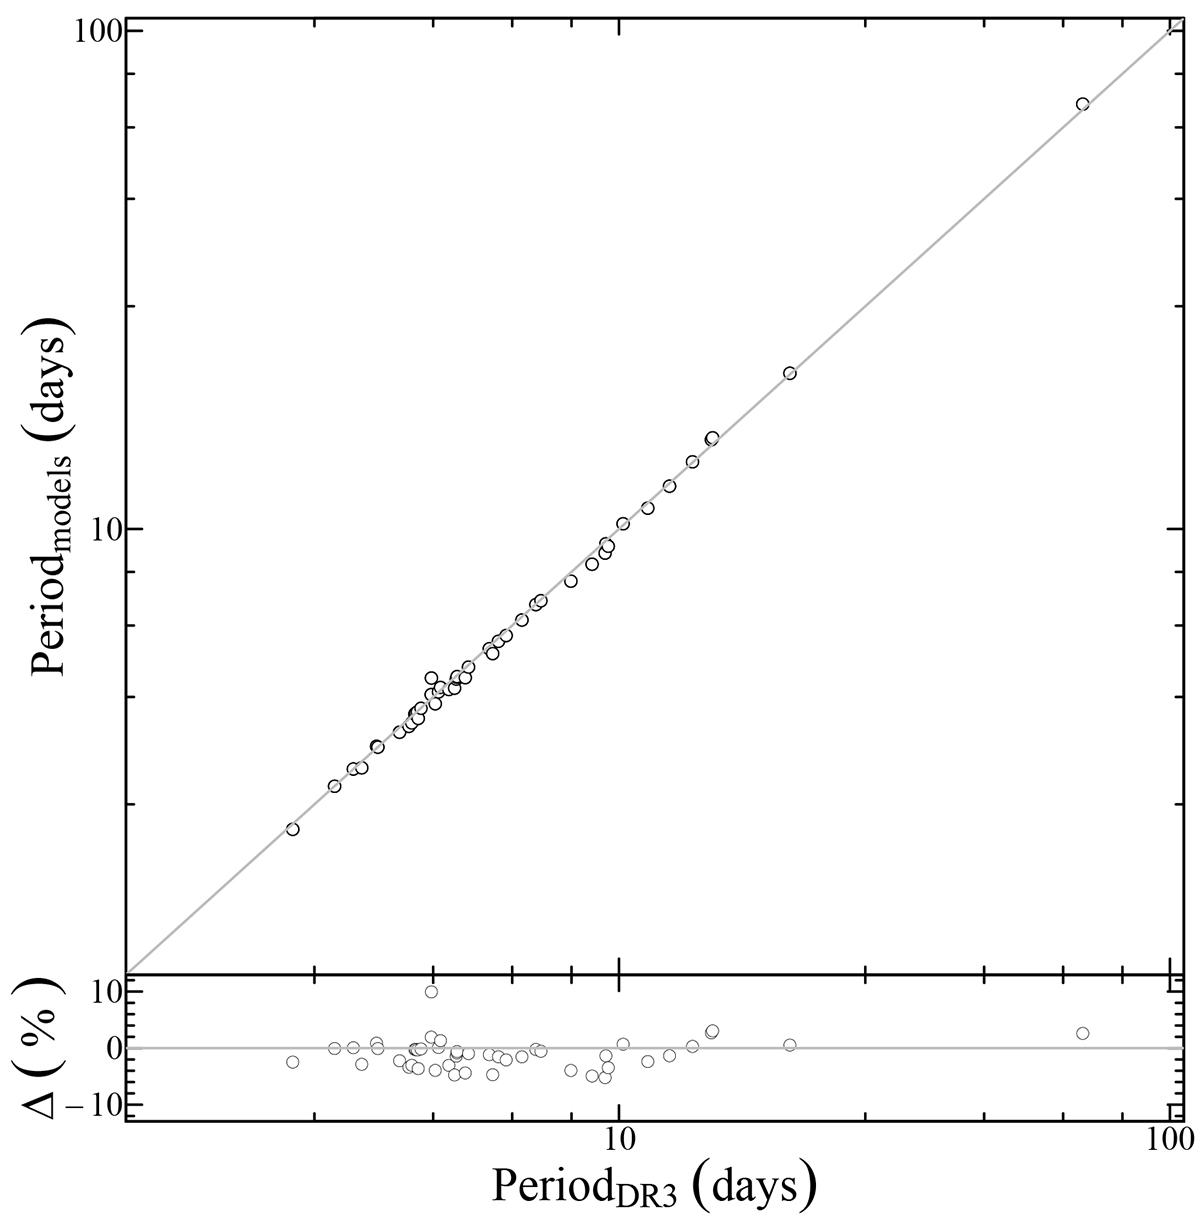
Top panel: Modelled period values (vertical axis) versus the DR3 periods (horizontal axis). The 1:1 line is also plotted to facilitate the comparison. Bottom panel: Percentage difference between the theoretical periods and the DR3 values as a function of the observational period.
Current usage metrics show cumulative count of Article Views (full-text article views including HTML views, PDF and ePub downloads, according to the available data) and Abstracts Views on Vision4Press platform.
Data correspond to usage on the plateform after 2015. The current usage metrics is available 48-96 hours after online publication and is updated daily on week days.
Initial download of the metrics may take a while.