Open Access
Fig. 5.
Download original image
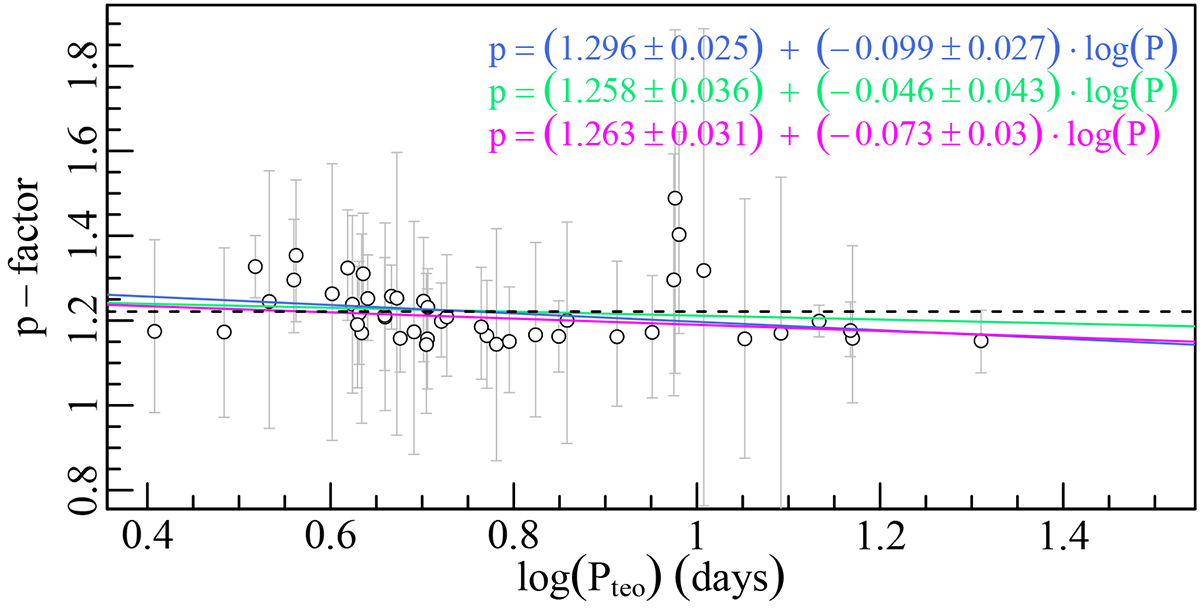
p-factor as a function of the best-fit pulsational period. Three kinds of linear fits are also reported: the weighted linear fit (blue line), the unweighted linear fit (green line), and the robust linear fit (magenta line). The dashed black line indicates the median p-factor computed by considering the whole sample.
Current usage metrics show cumulative count of Article Views (full-text article views including HTML views, PDF and ePub downloads, according to the available data) and Abstracts Views on Vision4Press platform.
Data correspond to usage on the plateform after 2015. The current usage metrics is available 48-96 hours after online publication and is updated daily on week days.
Initial download of the metrics may take a while.