Open Access
Fig. 7.
Download original image
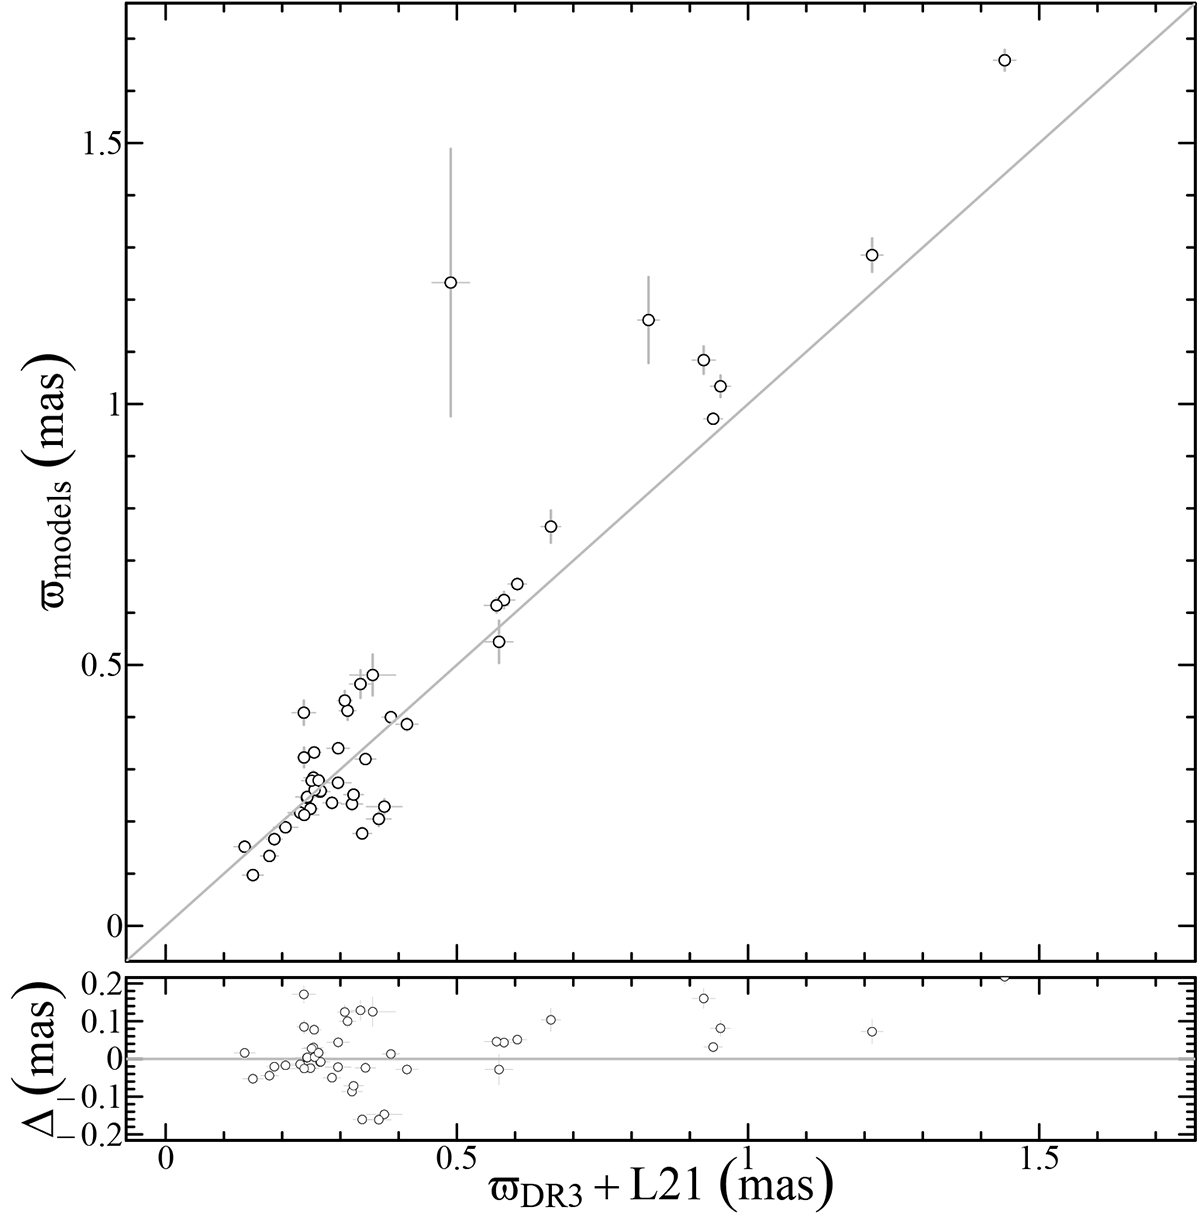
Top panel: Comparison between the Gaia DR3 parallaxes, corrected according to the L21 recipe, and those obtained from our pulsation model fitting technique, shown together with 1:1 line (grey solid). Bottom panel: Residuals, ![]() , around the 1:1 line plotted against the DR3+L21 parallaxes.
, around the 1:1 line plotted against the DR3+L21 parallaxes.
Current usage metrics show cumulative count of Article Views (full-text article views including HTML views, PDF and ePub downloads, according to the available data) and Abstracts Views on Vision4Press platform.
Data correspond to usage on the plateform after 2015. The current usage metrics is available 48-96 hours after online publication and is updated daily on week days.
Initial download of the metrics may take a while.