Fig. 8.
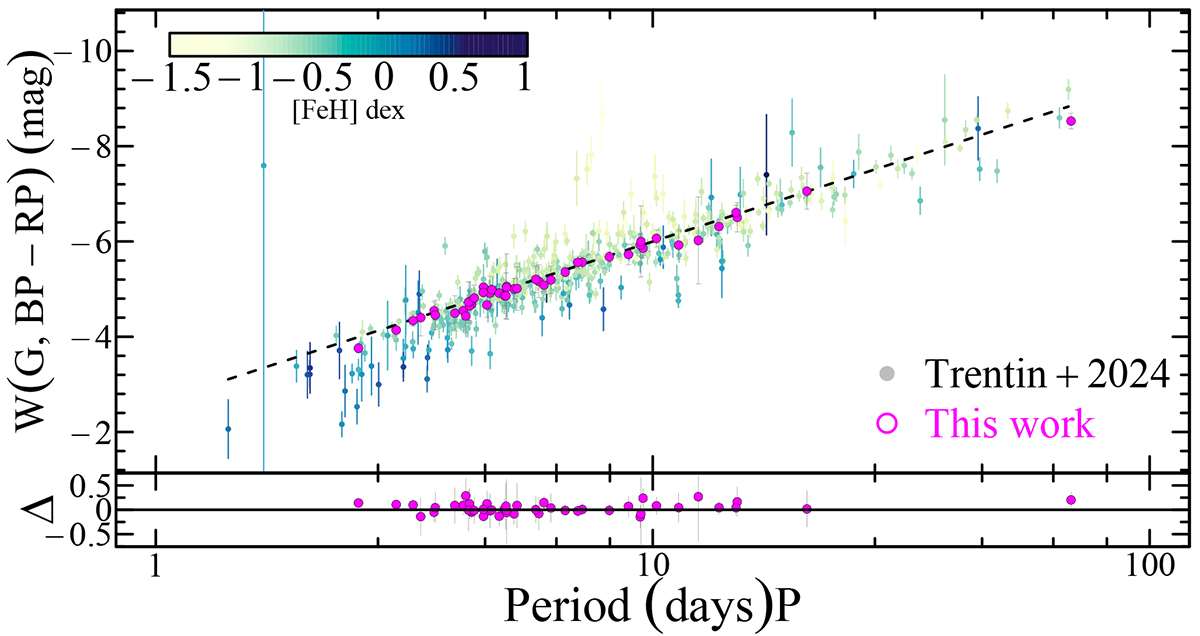
Download original image
Absolute Wesenheit magnitude plotted against the pulsation period. The fundamental CCs from T24 are also plotted and coloured according to their [FeH] values, together with their best PWZ fitted relation (dashed line). The same quantities for the sample studied in this work are also plotted, together with their errors, with magenta circles. Their residuals around the plotted fit are also shown in the bottom panel.
Current usage metrics show cumulative count of Article Views (full-text article views including HTML views, PDF and ePub downloads, according to the available data) and Abstracts Views on Vision4Press platform.
Data correspond to usage on the plateform after 2015. The current usage metrics is available 48-96 hours after online publication and is updated daily on week days.
Initial download of the metrics may take a while.