Fig. 1.
Download original image
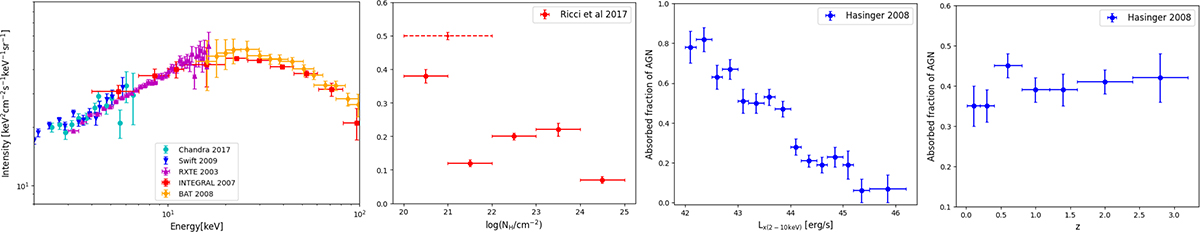
X-ray observables used as constraints in this work. From the left: CXB measured by Chandra (cyan; Cappelluti et al. 2017), INTEGRAL (red; Churazov et al. 2007), RXTE (magenta; Revnivtsev et al. 2003), Swift/BAT (orange; Ajello et al. 2008), and Swift/XRT (blue; Moretti et al. 2009). The observed NH distribution of 731 AGNs in the 70-month Swift/BAT catalogue, detected in the 14–195 keV range, from Ricci et al. (2017a). The point with the dashed error bars represents the sum of the first two bins used in this work (see Sect. 2.2 for more information). The absorbed fraction of 1290 AGNs from multiple surveys in the 2–10 keV range is shown as a function of observed luminosity and as a function of redshift from Hasinger (2008).
Current usage metrics show cumulative count of Article Views (full-text article views including HTML views, PDF and ePub downloads, according to the available data) and Abstracts Views on Vision4Press platform.
Data correspond to usage on the plateform after 2015. The current usage metrics is available 48-96 hours after online publication and is updated daily on week days.
Initial download of the metrics may take a while.