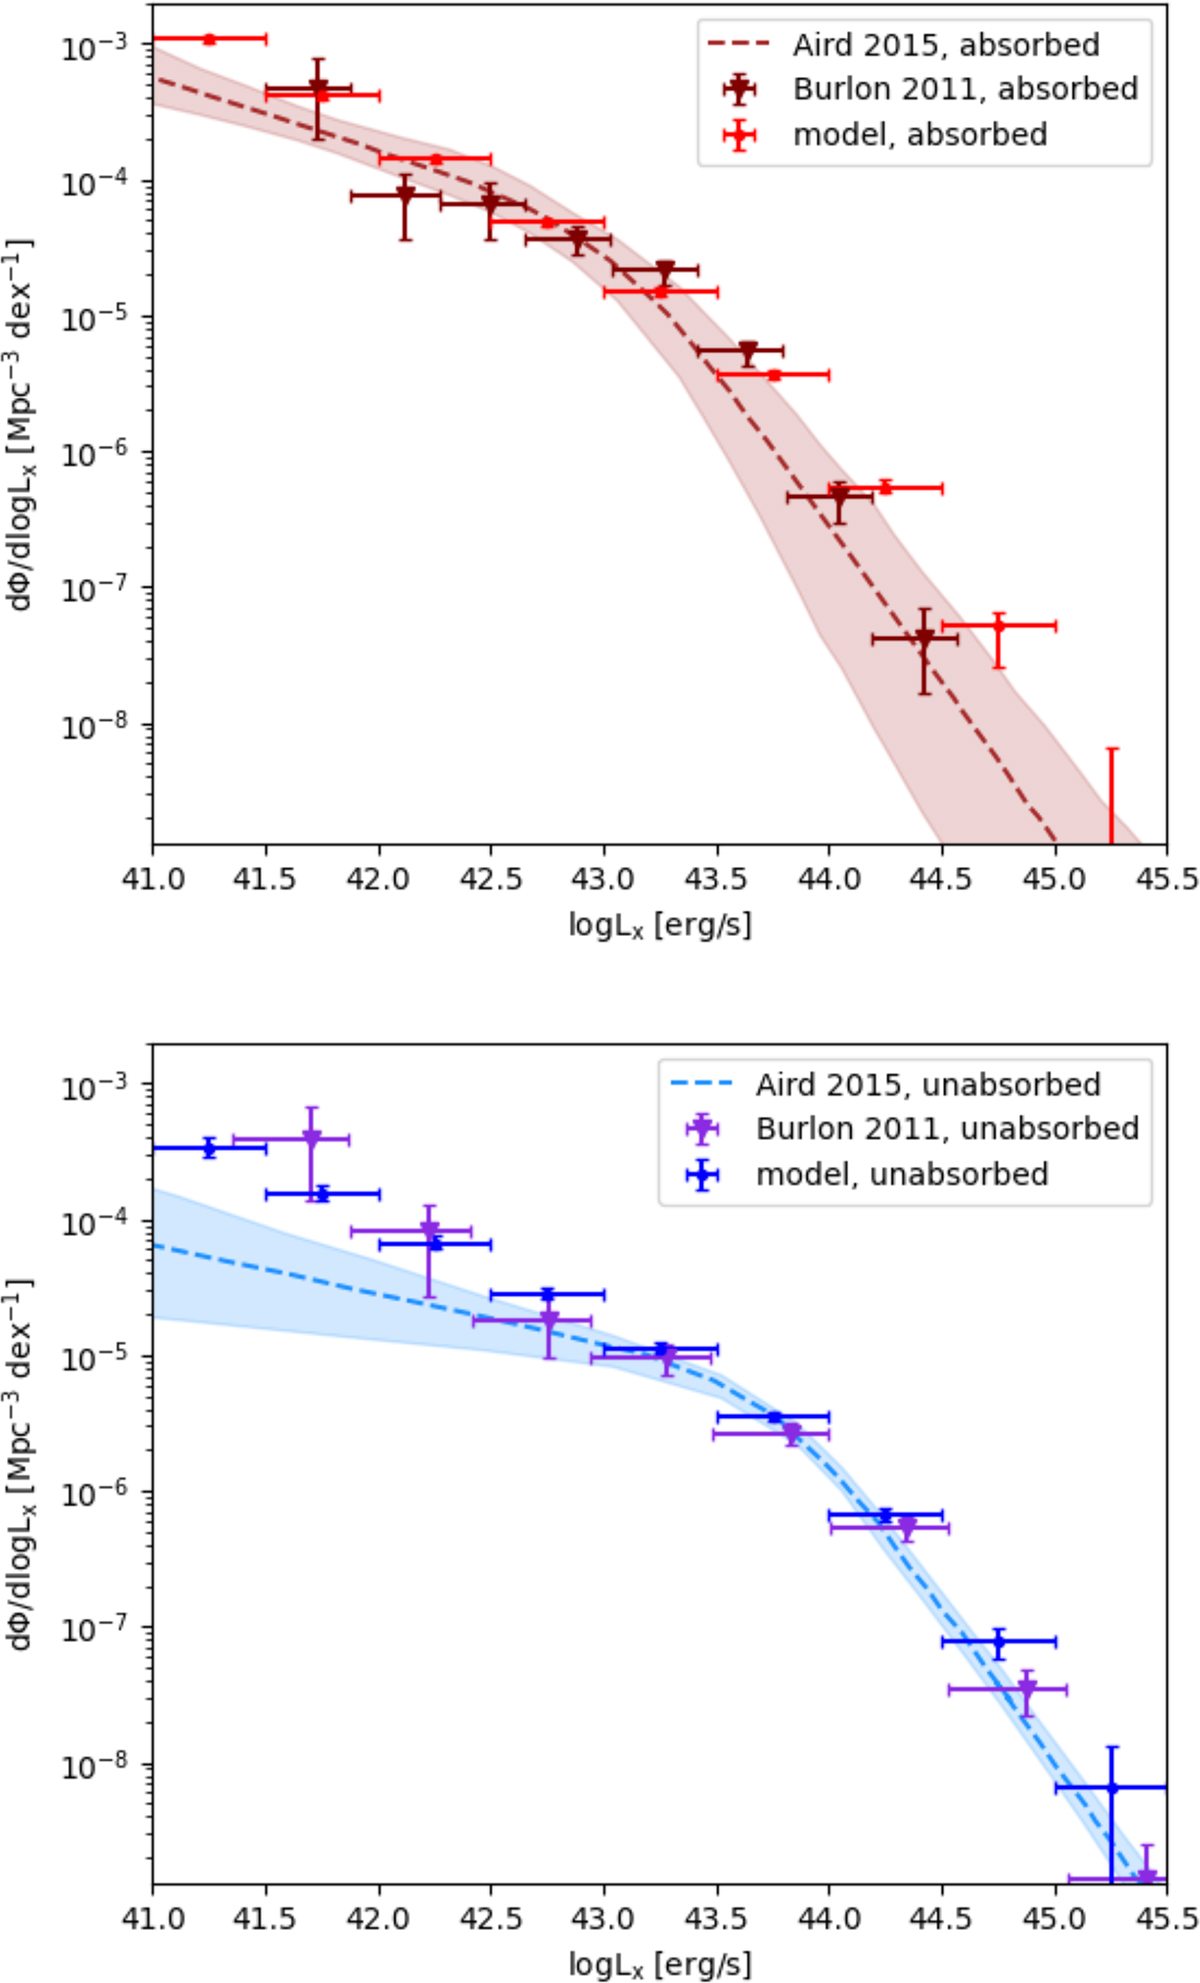
Fig. 10.
Download original image
X-ray luminosity function of absorbed (red points) and unabsorbed (blue points) AGNs in our population up to z = 0.1, using the LD+AD model with our combined constraints. The error bars represent the 68% confidence interval of the model based on the posterior distribution of the parameters. Top: Comparison of absorbed XLF with Fig. 13 of Aird et al. (2015), where they extrapolated their model at z = 0 (brown dashed line) and present the local observations of Burlon et al. (2011) converted to 2–10 keV luminosities (brown triangles). Bottom: Same comparison of unabsorbed XLF with Aird et al. (2015) (blue dashed line) and Burlon et al. (2011) (purple triangles).
Current usage metrics show cumulative count of Article Views (full-text article views including HTML views, PDF and ePub downloads, according to the available data) and Abstracts Views on Vision4Press platform.
Data correspond to usage on the plateform after 2015. The current usage metrics is available 48-96 hours after online publication and is updated daily on week days.
Initial download of the metrics may take a while.