Open Access
Fig. 14.
Download original image
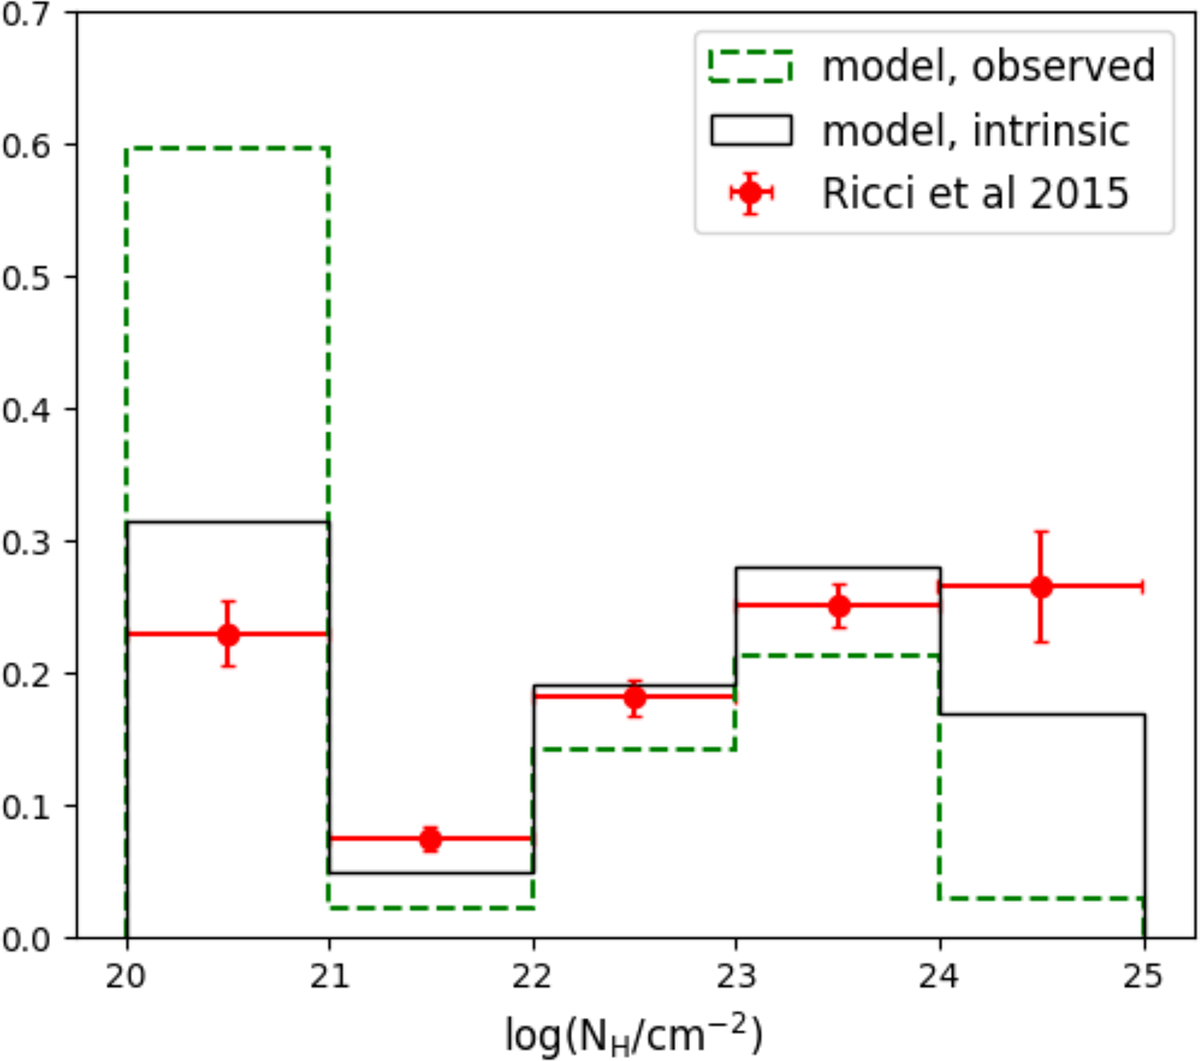
Intrinsic NH distribution (black line) of our local synthetic population produced using the LD+AD model with the combined constraints. Our observed distribution (green line) from Fig. 8 and the intrinsic distribution from Ricci et al. (2015) (red points) are shown for comparison.
Current usage metrics show cumulative count of Article Views (full-text article views including HTML views, PDF and ePub downloads, according to the available data) and Abstracts Views on Vision4Press platform.
Data correspond to usage on the plateform after 2015. The current usage metrics is available 48-96 hours after online publication and is updated daily on week days.
Initial download of the metrics may take a while.