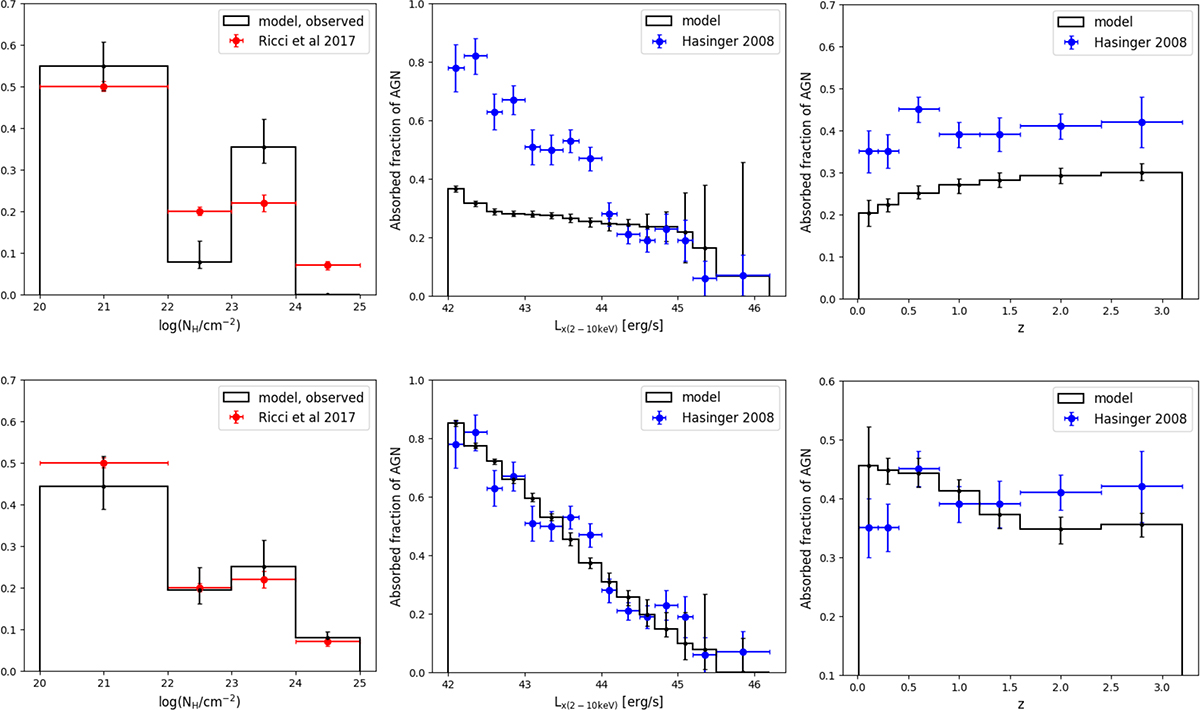
Fig. 6.
Download original image
Median models (black lines) for the three observed absorption properties using the simple torus model (top row) and the LD torus (bottom row) applied only to the three absorption data sets. Left: Fraction of NH in bins of log(NH). Middle: Absorbed fraction of AGNs as a function of observed LX(2–10 keV). Right: Absorbed fraction of AGNs as a function of redshift. The error bars on the models represent their 68% confidence interval based on the posterior distribution of the parameters.
Current usage metrics show cumulative count of Article Views (full-text article views including HTML views, PDF and ePub downloads, according to the available data) and Abstracts Views on Vision4Press platform.
Data correspond to usage on the plateform after 2015. The current usage metrics is available 48-96 hours after online publication and is updated daily on week days.
Initial download of the metrics may take a while.