Fig. 2
Download original image
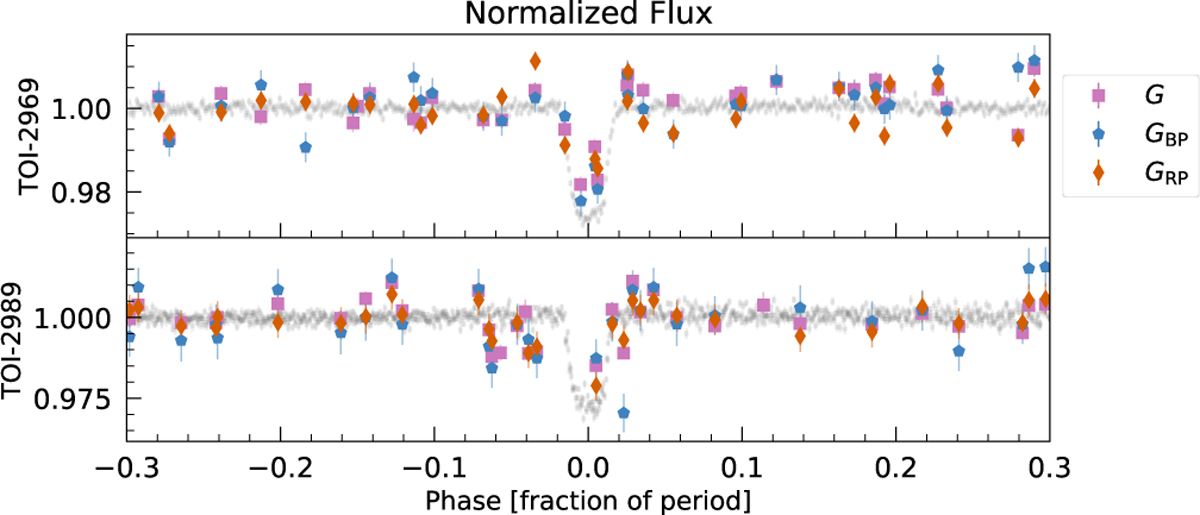
Phase-folded Gaia photometric data. Colored points indicate the different Gaia wave bands. The black points show the TESS data, binned in intervals of 1/1000 of the period. The errors in the Gaia data are corrected following Evans et al. (2023) by adding an error in quadrature as a function of the magnitude. Long-period signals above 0.01% false alarm probability (FAP) are subtracted, and the errors are scaled by the ratio of the standard deviation before and after signal subtraction.
Current usage metrics show cumulative count of Article Views (full-text article views including HTML views, PDF and ePub downloads, according to the available data) and Abstracts Views on Vision4Press platform.
Data correspond to usage on the plateform after 2015. The current usage metrics is available 48-96 hours after online publication and is updated daily on week days.
Initial download of the metrics may take a while.