Fig. 2
Download original image
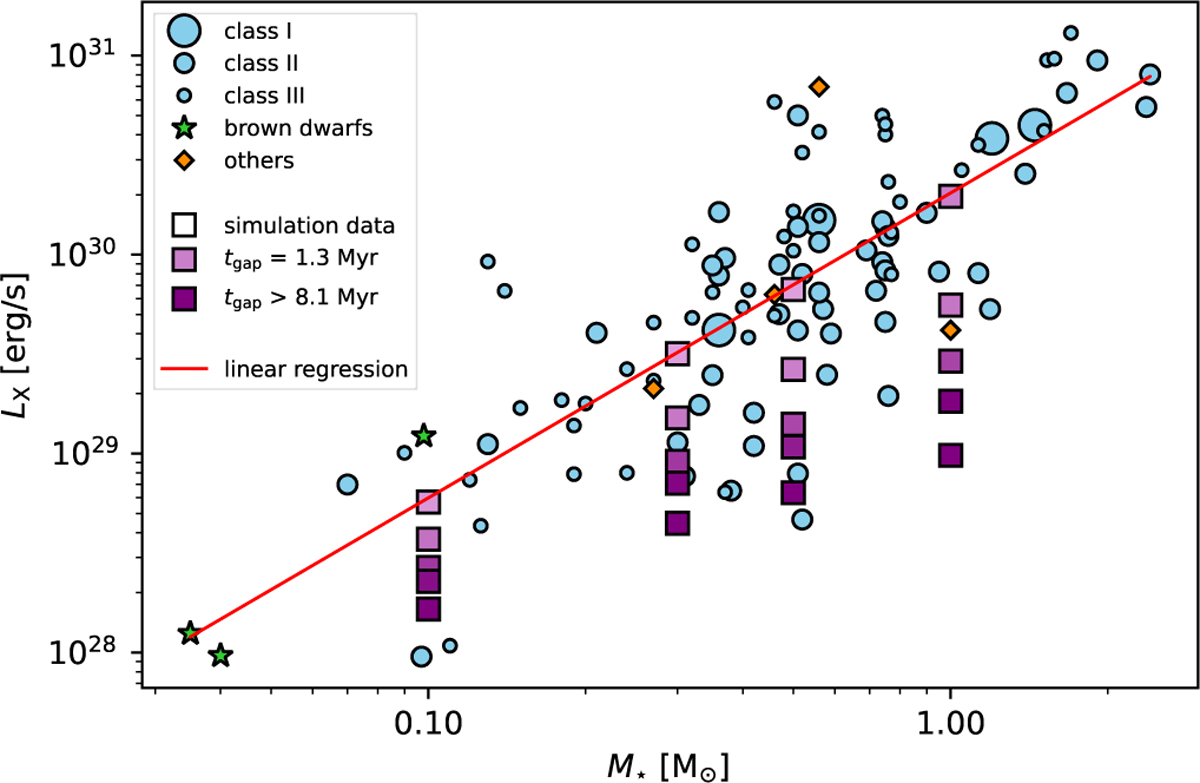
X-ray luminosity, derived from the measured X-ray flux, as a function of stellar mass for all detected XEST sources, re-plotted from Güdel et al. (2007) using their original data. The distance to Taurus is estimated at 140 pc, although we note that Taurus consists of subgroups with varying distances (Galli et al. 2019). The flux of stars with more than one measurement is averaged to retrieve only one data point for the plot. The circle, star, and diamond symbols indicate the stellar class, as defined for XEST sources; and the straight line gives a linear regression for the logarithmic values, as described by the following equation, log(LX) = 1.54 log(M★) + 30.31. Synthetic values from our simulations from Sections 3.2 and 3.3 are added as purple-coloured squares, with the colour indicating the gap opening time of the disc, tgap.
Current usage metrics show cumulative count of Article Views (full-text article views including HTML views, PDF and ePub downloads, according to the available data) and Abstracts Views on Vision4Press platform.
Data correspond to usage on the plateform after 2015. The current usage metrics is available 48-96 hours after online publication and is updated daily on week days.
Initial download of the metrics may take a while.