Fig. 3
Download original image
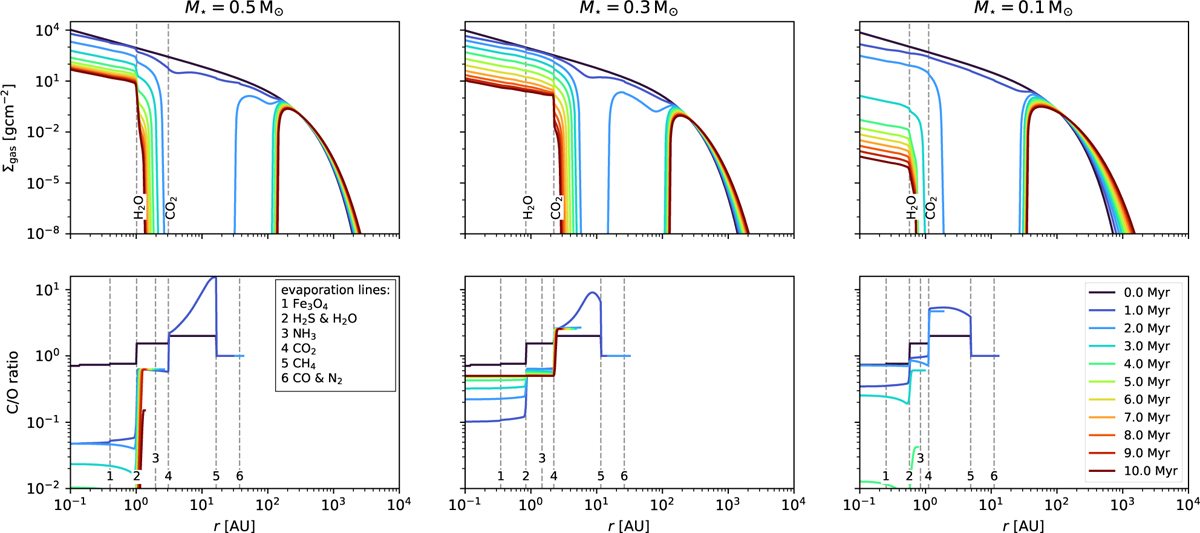
Disc evolution for a viscous disc with internal photoevaporation due to X-rays, using the nominal photoevaporative mass loss rates from Table 1. The host star masses vary from 0.5 M⊙ (on the left) to 0.1 M⊙ (on the right). Top: gas surface density as a function of disc radius, time evolution is shown in colour - from black, which corresponds to 0 Myr, to dark red, which corresponds to 10 Myr. Bottom : gaseous C/O ratio as a function of disc radius and time (colour-coded). The evaporation lines for the different molecules are given as dashed grey lines. Note that the C/O ratio is calculated from number densities and that, by definition, we have no specified C/O ratio in the gas phase beyond the CO evaporation front. We use our standard parameters for this simulation, as given in Table 3.
Current usage metrics show cumulative count of Article Views (full-text article views including HTML views, PDF and ePub downloads, according to the available data) and Abstracts Views on Vision4Press platform.
Data correspond to usage on the plateform after 2015. The current usage metrics is available 48-96 hours after online publication and is updated daily on week days.
Initial download of the metrics may take a while.