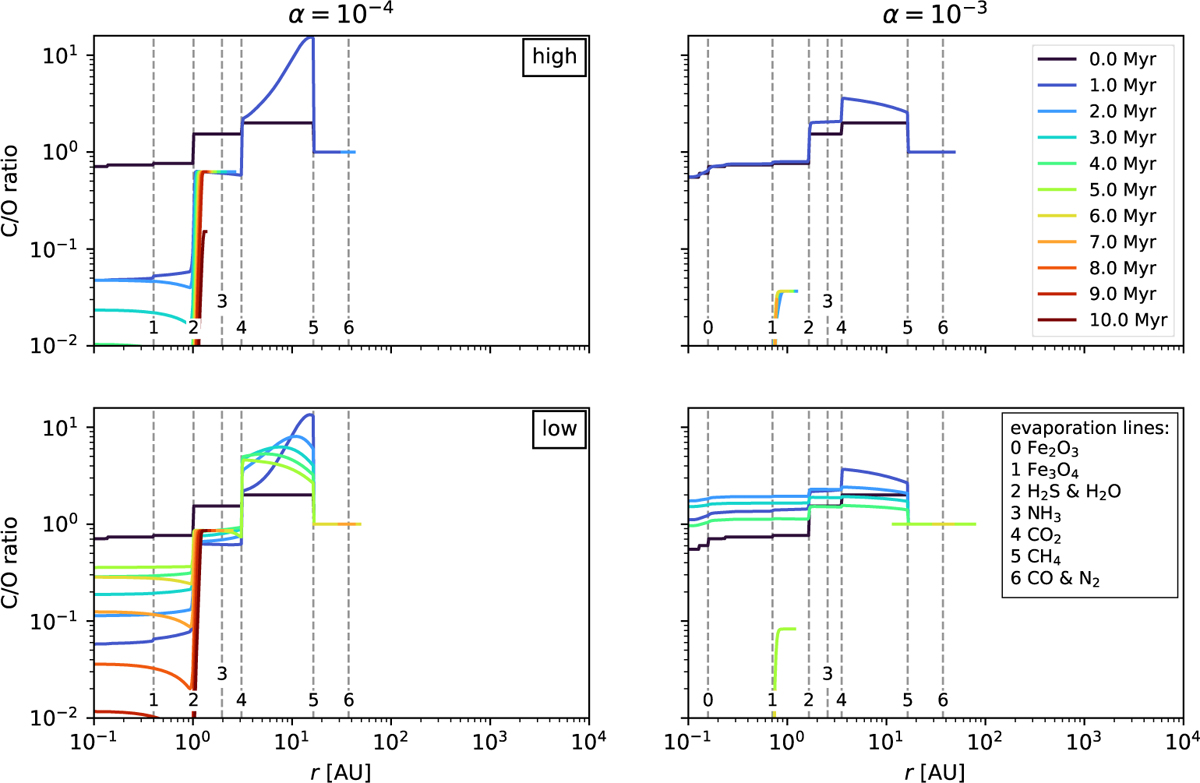
Fig. 6
Download original image
Gaseous C/O ratios as a function of disc radius and time for discs with internal photoevaporation due to X-rays and a host star mass of 0.5 M⊙. This plot shows a comparison between different α values and different photoevaporation rates, with the left column depicting α = 10−4, the right column depicting α = 103, the top row showing our nominal photoevaporation rate of Ṁw = 1.90460 · 108 M⊙yr−1 (see also Table 1), and the bottom row showing a reduced photoevaporation rate of Ṁw = 0.51324 · 10−8 M⊙ yr−1 (see also Table 2). Colour coding, plotting, and remaining simulation parameters are indicated as in Figure 3.
Current usage metrics show cumulative count of Article Views (full-text article views including HTML views, PDF and ePub downloads, according to the available data) and Abstracts Views on Vision4Press platform.
Data correspond to usage on the plateform after 2015. The current usage metrics is available 48-96 hours after online publication and is updated daily on week days.
Initial download of the metrics may take a while.