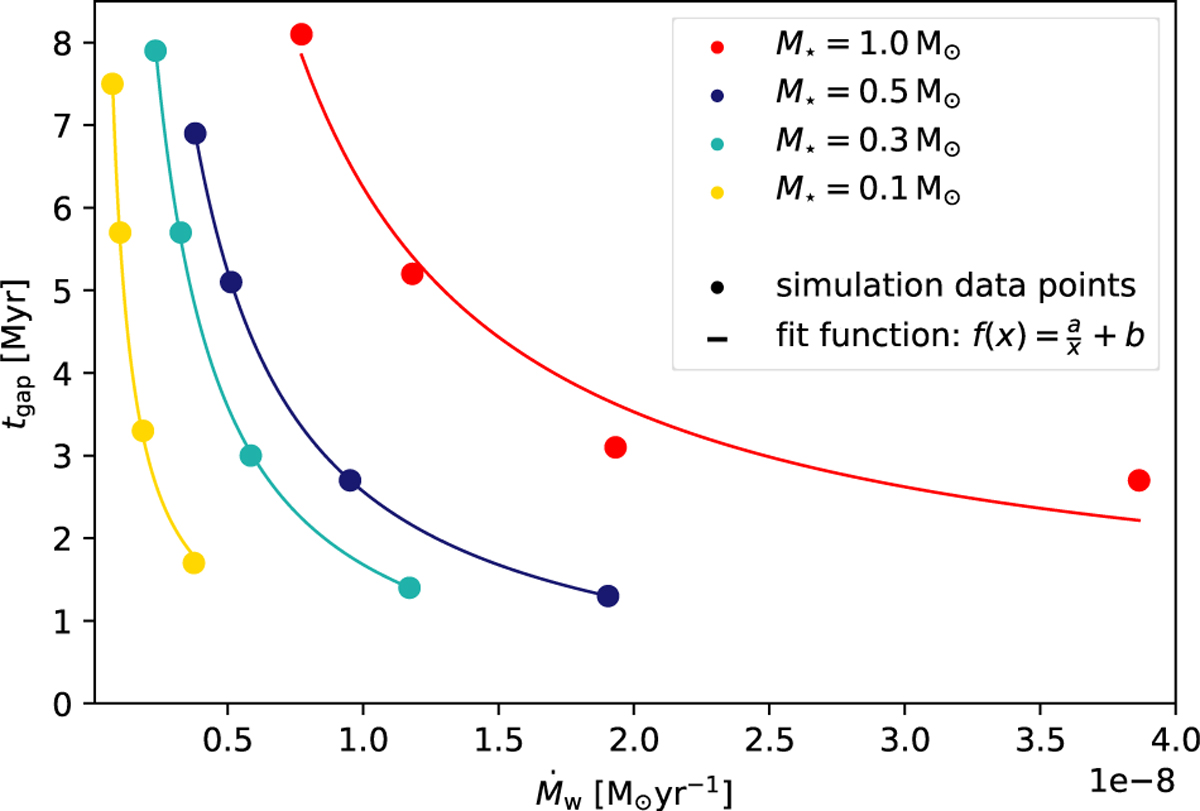
Fig. 7
Download original image
Gap opening time versus photoevaporation rate for the low-mass stars studied in this paper as well as the solar-mass star from Paper I (colour coded). Plotted are data points from our simulations, both from nominal (rightmost point of each line) and reduced photoevaporative mass loss rates with reduction factors of 2, 3-4, and 5, and a reciprocal fit through those points. The fit parameters for each stellar mass are listed in Table 4.
Current usage metrics show cumulative count of Article Views (full-text article views including HTML views, PDF and ePub downloads, according to the available data) and Abstracts Views on Vision4Press platform.
Data correspond to usage on the plateform after 2015. The current usage metrics is available 48-96 hours after online publication and is updated daily on week days.
Initial download of the metrics may take a while.