Fig. 15.
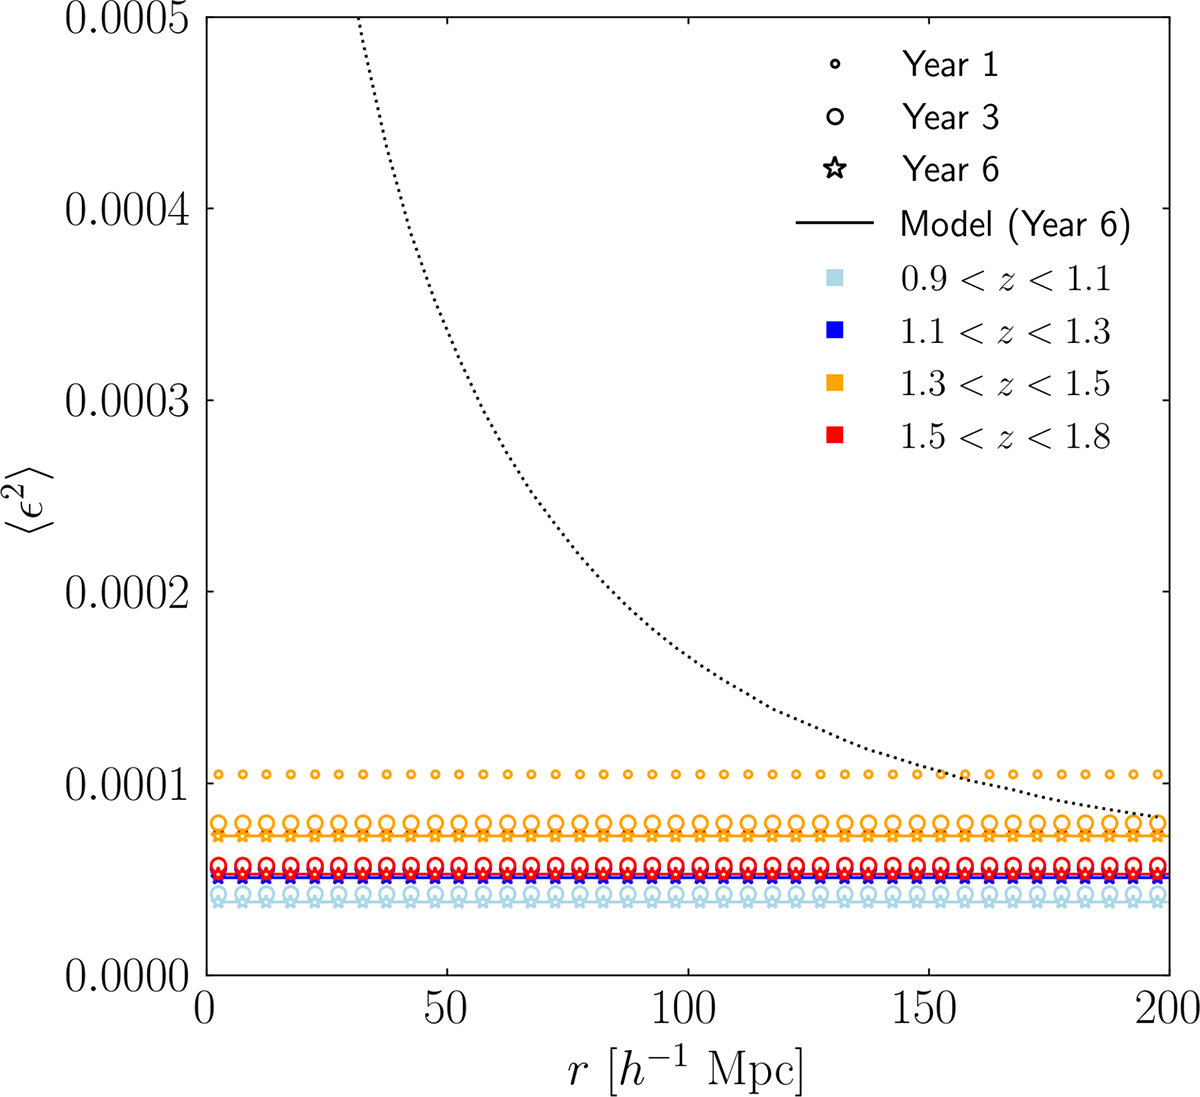
Download original image
Impact of the integral constraint on the monopole correlation function in the Euclid Wide Survey. The curves with the different different symbols show the leading integral-constraint term ⟨ϵ2⟩, after 1, 3, and 6 years of observation respectively. The solid curves show the same quantity for year 6 observations, but when the integral constraint effect is derived from a model correlation function. The different colours show this quantity for the redshift intervals: 0.9 < z < 1.1, 1.1 < z < 1.3, 1.3 < z < 1.5, 1.5 < z < 1.8. The dotted curves delineate the expected 1σ statistical uncertainty on the monopole correlation function in the completed Euclid Wide Survey in the interval 1.1 < z < 1.3.
Current usage metrics show cumulative count of Article Views (full-text article views including HTML views, PDF and ePub downloads, according to the available data) and Abstracts Views on Vision4Press platform.
Data correspond to usage on the plateform after 2015. The current usage metrics is available 48-96 hours after online publication and is updated daily on week days.
Initial download of the metrics may take a while.