Fig. 3.
Download original image
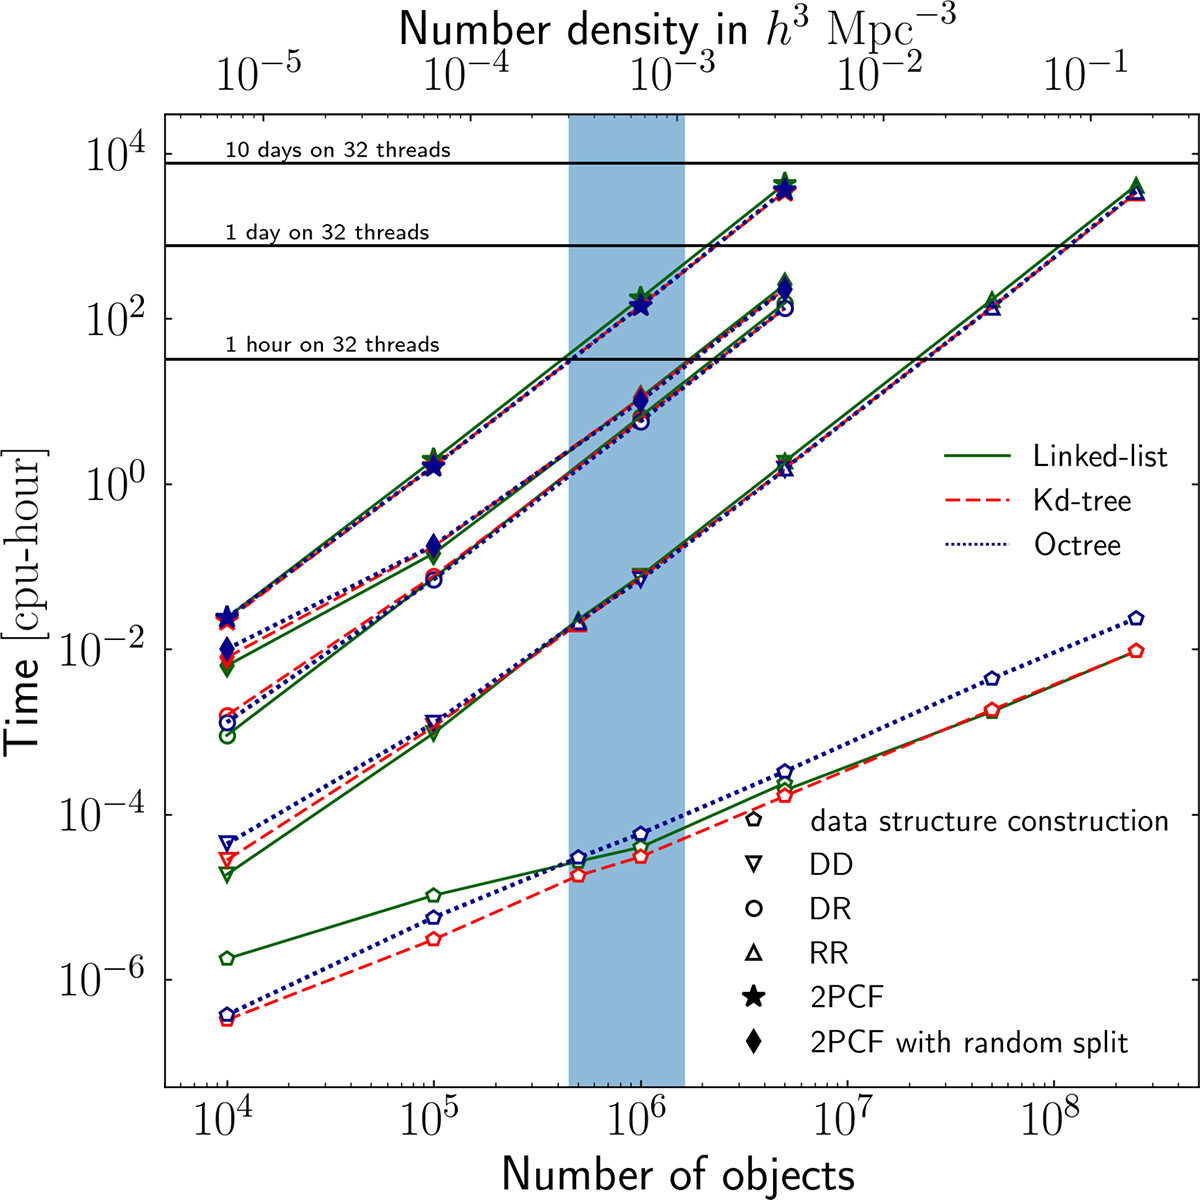
Run times for the calculation of the multipole correlation of galaxies obtained from the ELM mock. The times are expressed in CPU-hour and as a function of the data or random catalogue size. The various symbols represent the time spent on the data structure construction, DD calculation, DR calculation, RR calculation, and the overall 2PCF runtime with and without random split option. The DR calculation times are provided as a function of the number of objects in the data catalogue and assuming a fifty times larger random catalogue. The different curves represent the runtimes obtained with the linked-list (solid), k-d tree (dashed), and octree (dotted) algorithms. The blue vertical band shows the range of expected number densities in the spectroscopic sample at redshifts within 0.9 < z < 1.8. The abscissa refers to the number of object in the data catalogue except for RR calculation where it refers to that in the random catalogue.
Current usage metrics show cumulative count of Article Views (full-text article views including HTML views, PDF and ePub downloads, according to the available data) and Abstracts Views on Vision4Press platform.
Data correspond to usage on the plateform after 2015. The current usage metrics is available 48-96 hours after online publication and is updated daily on week days.
Initial download of the metrics may take a while.