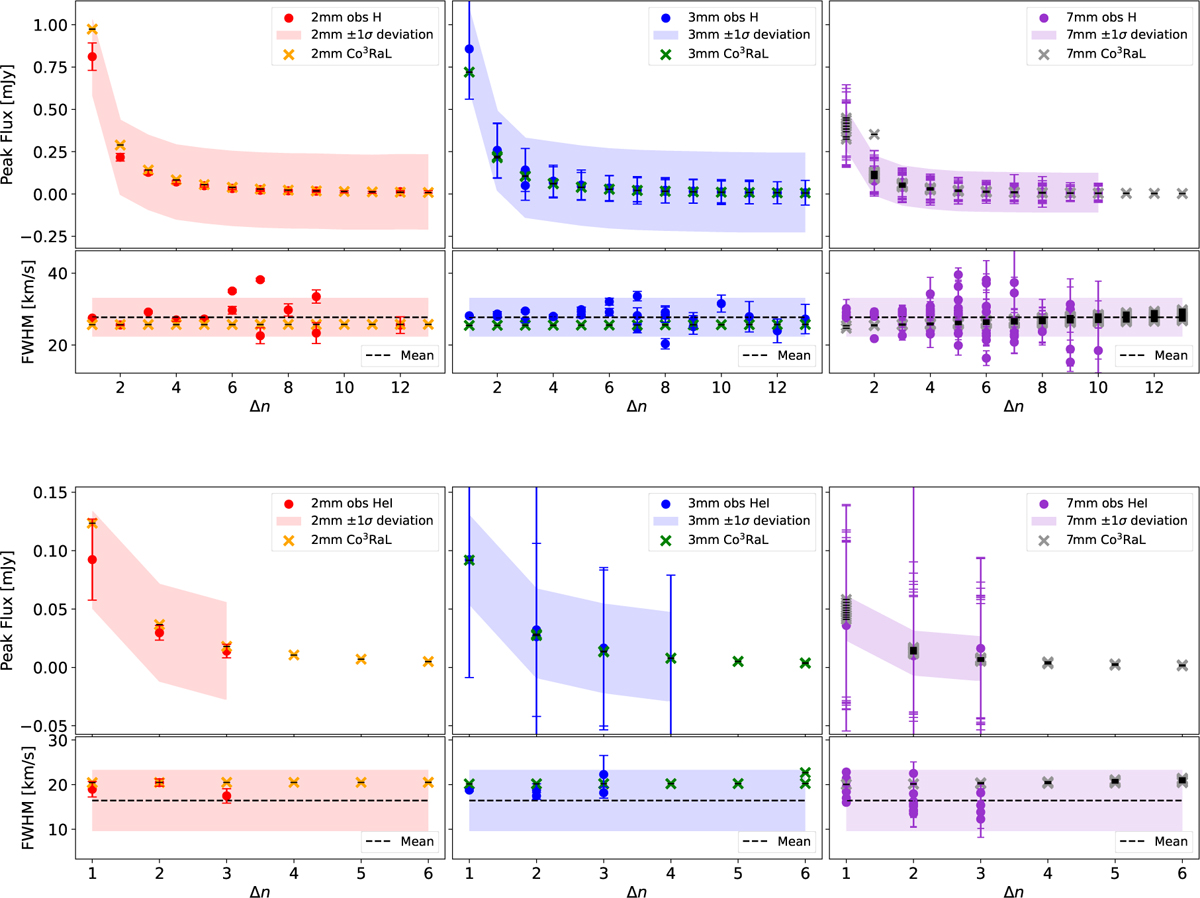
Fig. 6
Download original image
Compatibility of the Co3RaL model data (peak fluxes and FWHM in mJy and km s–1, respectively) with the observational ones for H (upper panel) and He I (lower panel) in PN IC 418. The dots represent the peak flux and FWHM of each observed emission line obtained with the Gaussian fit using the available procedure in CLASS with the respective errors, while the crosses represent the peak flux and FWHM values simulated by Co3RaL. All data are separated by frequency bands. The colored regions on the peak flux plots represent the ±1 σ deviation of the data at each frequency band. The colored regions on the FWHM plots represent the ±1 σ deviation from the observational FWHM mean (see Section 2 for more details).
Current usage metrics show cumulative count of Article Views (full-text article views including HTML views, PDF and ePub downloads, according to the available data) and Abstracts Views on Vision4Press platform.
Data correspond to usage on the plateform after 2015. The current usage metrics is available 48-96 hours after online publication and is updated daily on week days.
Initial download of the metrics may take a while.