Fig. 10.
Download original image
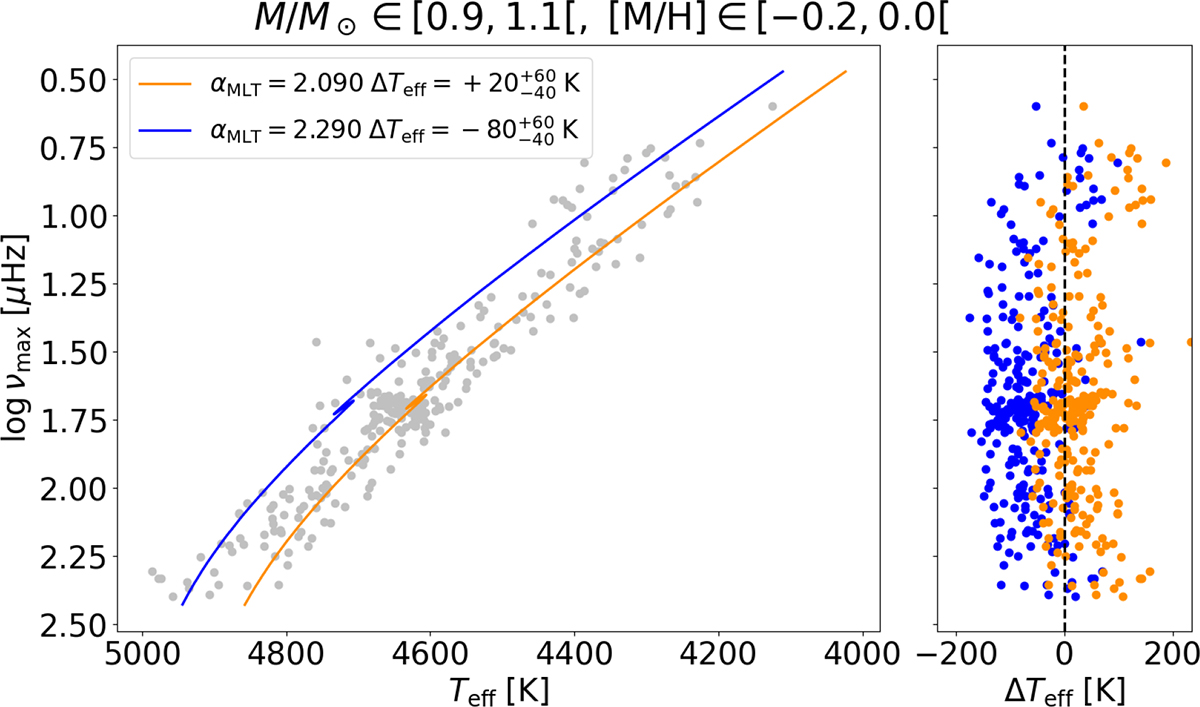
Left panel: Teff − log νmax diagram for field stars with M/M⊙ ∈ [0.9, 1.1[ and [M/H]∈[−0.2, 0.0[ dex (grey points) and corresponding evolutionary tracks with αMLT = 2.090 (orange line) and αMLT = 2.290 (blue line). Right panel: Temperature differences between data and evolutionary tracks, with the same colour-coding of the left panel.
Current usage metrics show cumulative count of Article Views (full-text article views including HTML views, PDF and ePub downloads, according to the available data) and Abstracts Views on Vision4Press platform.
Data correspond to usage on the plateform after 2015. The current usage metrics is available 48-96 hours after online publication and is updated daily on week days.
Initial download of the metrics may take a while.