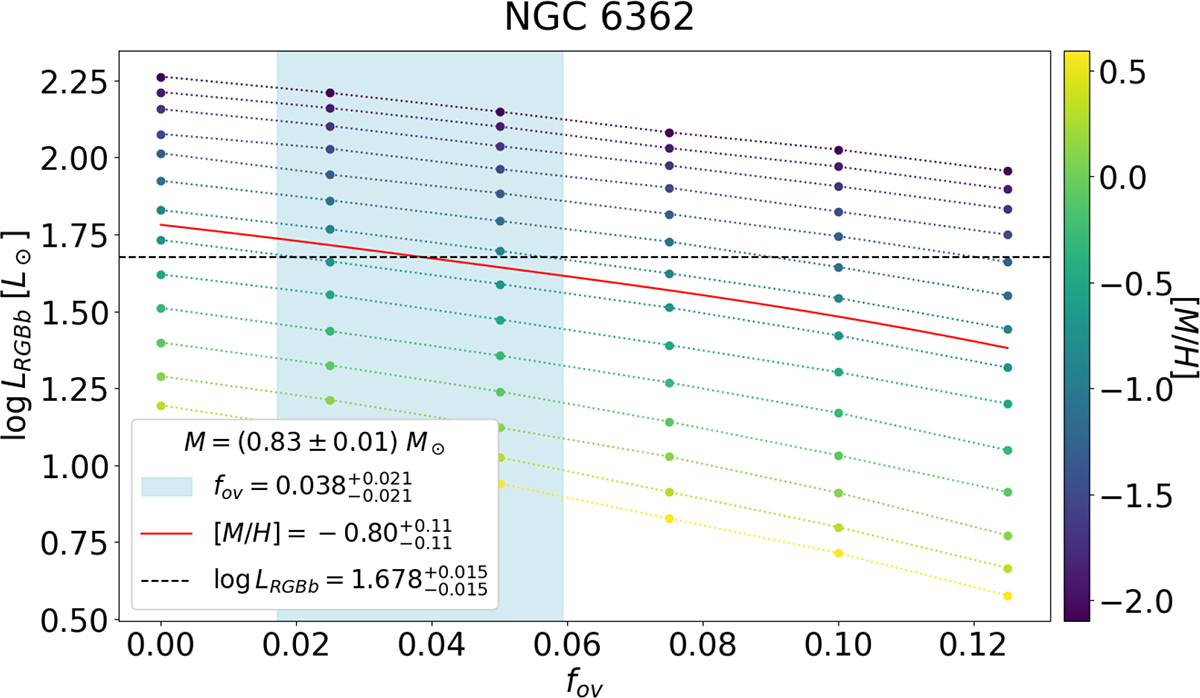
Fig. 4.
Download original image
Representation in fov − log L plane of interpolation procedure to derive overshooting efficiency for GC NGC 6362. The expectation values of [M/H] and log LRGBb are represented by the solid red line and the dashed black one, respectively, and are plotted on the grid of models computed at the cluster mass (coloured according to metallicity). The light blue shaded zone represents the confidence interval at 68% of the derived overshooting efficiency.
Current usage metrics show cumulative count of Article Views (full-text article views including HTML views, PDF and ePub downloads, according to the available data) and Abstracts Views on Vision4Press platform.
Data correspond to usage on the plateform after 2015. The current usage metrics is available 48-96 hours after online publication and is updated daily on week days.
Initial download of the metrics may take a while.