| Issue |
A&A
Volume 700, August 2025
|
|
|---|---|---|
| Article Number | A44 | |
| Number of page(s) | 19 | |
| Section | Stellar structure and evolution | |
| DOI | https://doi.org/10.1051/0004-6361/202553983 | |
| Published online | 01 August 2025 | |
The O Vz stars in NGC 346: Distribution, stellar parameters, and insights into low-metallicity effects
1
Universidad de La Serena, Departamento de Física y Astronomía, Av. Raúl Bitrán 1305, La Serena, Chile
2
Instituto de Astrofísica de Canarias, E-38200 La Laguna, Tenerife, Spain
3
Instituto de Astrofísica de La Plata, CONICET-UNLP, Paseo del Bosque s/n, B1900FWA La Plata, Argentina
4
Facultad de Ciencias Astronómicas y Geofísicas, Universidad Nacional de La Plata, Paseo del Bosque s/n, B1900FWA La Plata, Argentina
5
Las Campanas Observatory, Carnegie Observatories, Casilla 601, La Serena, Chile
⋆ Corresponding author: This email address is being protected from spambots. You need JavaScript enabled to view it.
Received:
31
January
2025
Accepted:
23
June
2025
Abstract
Context. O Vz stars are identified by optical spectra where the He II λ4686 absorption line is more intense than any other He line, suggesting they may be less luminous, less evolved, and closer to the zero-age main sequence (ZAMS). Despite ongoing debate, these stars remain candidates for understanding the early evolutionary stages of O-type stars.
Aims. We study O Vz stars in the star-forming regions NGC 346 in the Small Magellanic Cloud and 30 Doradus in the Large Magellanic Cloud by determining their physical parameters and exploring the influence of low metallicity on the development of the Vz spectral peculiarity.
Methods. We identified a sample of O Vz and O V stars in NGC 346 using spectra obtained with the Magellan Echellette spectrograph at Las Campanas Observatory. The stars were classified based on the relationship between the equivalent width of the relevant He lines. Quantitative spectroscopic analysis was performed using the IACOB-BROAD, IACOB-GBAT/FASTWIND tools. The O V and O Vz stars from 30 Doradus, previously identified in an earlier study, were reclassified following the same criteria.
Results. In NGC 346, 8 O Vz stars (29%) and 20 O V stars (71%) were identified. After a revised classification in 30 Doradus, 28 O,Vz stars (33%) and 56 O V stars (67%) were identified. Despite differences in sample sizes and metallicity, the proportion of O Vz stars is similar in both regions. O Vz stars in NGC 346 exhibit lower projected rotational velocities (v sin i < 70 km s−1), higher effective temperatures (37–40 kK) and similar surface gravities (logg = 3.7 − 4.1) compared to O V stars. Contrary to prior assumptions, O Vz stars are not consistently closer to the ZAMS. In the Hertzsprung-Russell diagram, O Vz stars appear in both young and evolved regions, suggesting that the Vz phenomenon is related to stellar wind properties.
Key words: techniques: spectroscopic / stars: fundamental parameters / stars: massive
© The Authors 2025
 Open Access article, published by EDP Sciences, under the terms of the Creative Commons Attribution License (https://creativecommons.org/licenses/by/4.0), which permits unrestricted use, distribution, and reproduction in any medium, provided the original work is properly cited.
This article is published in open access under the Subscribe to Open model. This email address is being protected from spambots. You need JavaScript enabled to view it. to support open access publication.
1. Introduction
Massive stars play a fundamental role in galactic evolution, yet our understanding of their formation and early evolution remains limited. These stars are challenging to study because they are often located in distant regions with significant extinction and exhibit extraordinary properties, such as intense stellar winds (Kudritzki & Puls 2000; Bestenlehner et al. 2014; Hawcroft et al. 2024), significant mass loss (Lucy 2012; Puls et al. 2008; Vink 2017), magnetic fields (Walder et al. 2012; Wade & Neiner 2017) and high luminosities. They are also relatively rare compared to lower-mass stars (Salpeter 1955) and have much shorter lifespans, typically ranging from 5 to 20 Myr (Ekström et al. 2012; Langer 2012). Studying these stars at the youngest possible stages is essential, as they may retain evidence of their formation processes.
Over the years, studies of O-type dwarfs in the optical domain, both in the Milky Way (MW) and the Magellanic Clouds–specifically the Small Magellanic Cloud (SMC) and the Large Magellanic Cloud (LMC)–have provided valuable insights into the physical properties and evolutionary stages of massive stars. Among these, a luminosity subclass known as O Vz stars has been identified. O Vz stars were first identified in the Galactic cluster Trumpler 14 (Walborn 1973) and later in the Magellanic Clouds (Parker et al. 1992; Walborn & Parker 1992; Walborn & Blades 1997). This subclass was introduced by Walborn & Blades (1997) and is defined by an enhanced absorption in the He II λ4686 line compared to other helium lines. This feature has been hypothesized to indicate lower luminosities and higher surface gravities, suggesting that O Vz stars are closer to the zero-age main sequence (ZAMS). While the Vz peculiarity has the potential to identify extremely young massive stars, only a limited number of such objects have been analyzed through quantitative spectroscopy (Sabín-Sanjulián et al. 2014; Holgado et al. 2020; Rickard et al. 2022).
Subsequent studies revealed that the interpretation of the Vz phenomenon is more complex, requiring the consideration of multiple factors beyond stellar winds (Sabín-Sanjulián et al. 2014; Arias et al. 2016). Detailed spectroscopic analyses and atmospheric models have shown that the appearance of the Vz feature in a stellar spectrum may depend on a specific combination of stellar parameters, including effective temperature, surface gravity, projected rotational velocity, and multiplicity. Moreover, in a systematic study of Galactic O-type stars from the Galactic O Star Spectroscopic Survey (GOSSS, Sota et al. 2011, 2013; Apellániz et al. 2016), Arias et al. (2016) quantitatively characterized the Vz phenomenon by analyzing the equivalent widths of the He I λ4471, He II λ4542, and He II λ4686 spectral lines. This work refined the criterion initially proposed by Sota et al. (2014), making it more stringent by assigning the “z” qualifier only to spectra where the equivalent width of He II λ4686 is at least 1.10 times the maximum equivalent width of either He I λ4471 or He II λ4542, depending on which of the two is stronger at the given spectral type.
The Magellanic Clouds, with metallicities of approximately 1/2 (LMC) and 1/5 (SMC) of the solar value, provide an ideal laboratory to investigate the effects of metallicity on massive star evolution and phenomena such as the Vz classification. NGC 346 in the SMC is the most O-star-rich star-forming region in the galaxy, housing nearly half of its known O-type stars (Massey et al. 1989). With an age of less than 3 Myr (Bouret et al. 2003), NGC 346 is one of the youngest and most massive clusters in the Local Group, offering a unique opportunity to study massive stars in a low-metallicity environment. The most comprehensive spectroscopic studies of this cluster to date include those by Dufton et al. (2019), who identified a very young population (< 2 Myr), and Rickard et al. (2022), who applied the quantitative Vz classification criterion of Arias et al. (2016) to identify one potential Vz star in the region.
In the LMC, 30 Doradus (30 Dor) is the most massive star-forming region in the Local Group (Walborn et al. 2014). It hosts the most massive stars known (Crowther 2010; Bestenlehner et al. 2011) and serves as a reference for massive star studies at low metallicities. Sabín-Sanjulián et al. (2014) analyzed O Vz stars in 30 Dor and found that, although these stars are generally closer to the ZAMS, many have ages between 2 and 4 Myr. This result suggests a potential connection between metallicity and the persistence of the Vz phase.
In this article, we perform a quantitative spectroscopic analysis of O Vz stars in NGC 346, using the Vz classification criterion proposed by Arias et al. (2016). Additionally, we compare the properties of O Vz and O V stars in NGC 346 with those previously analyzed in 30 Doradus by Sabín-Sanjulián et al. (2014). Our study builds on the former findings, providing a low-metallicity counterpart to further investigate how the Vz phenomenon may vary between different environments. The structure of this paper is as follows: in Section 2, we describe the observations, the Vz classification criteria, and the methods used to estimate stellar parameters. The results are presented in Section 3, followed by a detailed discussion in Section 4. Finally, a summary of our main findings is provided in Section 5.
2. Methodology
2.1. Sample of study
This study is primarily based on intermediate-resolution optical spectra obtained with the MagE spectrograph (Marshall et al. 2008), mounted on the Clay 6.5m telescope at Las Campanas Observatory. The MagE data were kindly provided by Phil Massey, Kathryn Neugent, and Nidia Morrell. These spectra were complemented with public VLT/FLAMES spectra, previously analyzed by Dufton et al. (2019). Confirmed spectroscopic binaries were excluded from the analysis.
The total sample of stars analyzed in NGC 346 comprises 37 objects. Throughout the paper, the designation “NGC 346-#Star” is adopted to ensure the proper identification of individual objects. Instrumental configurations and data characteristics are summarized in Table 1.
Characteristics of the spectra employed in this study.
Additionally, this study incorporates a reanalysis of a sample of stars in 30 Doradus, based on spectra from the VLT-FLAMES Tarantula Survey (Evans et al. 2011). The spectra for 30 Doradus were originally analyzed by Sabín-Sanjulián et al. (2014) [hereafter, SS14]. While their main characteristics are summarized in Table 1, the reader is referred to that paper for further details.
To assess the representativeness of our sample, we compared it with the Stellar Spectral Classification Catalog compiled by Skiff 2009, which aggregates spectral classifications from various sources, including stars in the SMC and specifically in NGC 346. Although this catalog is not a complete census, it provides a broad reference for the distribution of known O-type dwarf stars (luminosity class V) in the region, based on studies such Niemela et al. (1986), Massey et al. (1989), Smith Neubig & Bruhweiler (1997), Evans et al. (2006), Lamb et al. (2016), Dufton et al. (2019).
Figure 1 shows a histogram comparing the number of O-type dwarf stars reported in the Skiff catalog (blue bars) with those analyzed in this work (orange bars), broken down by spectral subtype. The green bars represent the stars common to both samples. The percentage labels in the green bars indicate, for each spectral subtype, the proportion of Skiff catalogue star present in our sample.
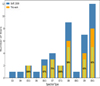 |
Fig. 1. Comparison between our sample (orange bars) of O-type stars with luminosity class V in NGC 346 and those previously reported in the literature (Skiff 2009, blue bars). The green bars represent the number of stars common to both samples. For each spectral subtype, the percentages indicate the fraction of stars in the Skiff catalogue that are also present in our sample. |
Although our sample was limited to the available spectra from previous observing campaigns, it spans the full range from O5.5 to O9.5 and includes a substantial fraction of stars in the most populated subtypes. This suggests that, despite its incompleteness, our sample reasonably reflects the overall spectral distribution of O-type dwarfs in NGC 346, providing a suitable basis for the analysis presented in this study.
2.2. Spectral classification
The spectral classifications for the stars in NGC 346, as listed in Table B.1, were reviewed and updated where necessary to ensure consistency. We followed the criteria established by the Galactic O-Star Spectroscopic Survey (Sota et al. 2011; Arias et al. 2016).
A key focus of this study was the classification of stars into the O V and O Vz subclasses. For this, we applied the quantitative criterion proposed by Arias et al. (2016) (hereafter A16), which is based on the equivalent widths (EWs) of the He I and He II lines relevant to the Vz classification.
The measurements were performed using the splot task in IRAF (Image Reduction and Analysis Facility, Tody 1993), like for interactive adjustment of spectral lines and integration of the area under the line profile. Errors in EW measurements were estimated based on the signal-to-noise ratio (S/N) and instrumental resolution. Specifically, uncertainties were calculated based on the line width at half-maximum intensity (FWHM) and continuum noise. The EW measurement and their errors are presented in Table 3. Since the resolving power of the instrument affects precision, the medium-resolution spectra sometimes resulted in overlapping or poorly defined line peaks, increasing measurement uncertainty. To validate our results, we compared the EWs obtained with IRAF to those calculated with a custom Python script, finding excellent agreement between the two methods, with minimal discrepancies.
Nebular contamination presented additional difficulties, particularly for the He I λ4471 line, where intense nebular emission interfered with the detection of the stellar lines. Similarly, the He II λ4542 line showed contamination in its blue wing from overlapping N II λλ4511/15 lines. In these cases, we integrated half of the line profile and doubled the value to estimate the total EW.
2.3. Quantitative spectral analysis
Our analysis strategy to estimate the stellar parameters of our sample relied on two semi-automated tools developed within the framework of the IACOB project: IACOB-BROAD (Simón-Díaz & Herrero 2014) and IACOB-GBAT (Simón-Díaz et al. 2011). The latter utilizes a grid of FASTWIND models (Santolaya-Rey et al. 1997; Puls et al. 2005), covering a wide range of stellar and wind parameters.
We started by calculating the broadening parameters, specifically the projected rotational velocity (v sin i) and the macroturbulence (vmac), using IACOB-BROAD. These parameters, which significantly influence the shape of stellar line profiles, were then used as input to determine additional stellar parameters with IACOB-GBAT. The analysis focused on the optical wavelength range (4000–5000 Å), allowing us to derive effective temperature (Teff), surface gravity (logg), the wind strength parameter (Q, Puls et al. 1996), helium abundance (Y(He)), microturbulence (ξt).
From the diverse set of FASTWIND grids incorporated in IACOB-GBAT, we selected models calculated for Z = 0.2 Z⊙, corresponding to the approximate metallicity of the SMC. The grid was constructed assuming the spectroscopic parameters are treated as free adjustable variables. The parameter ranges covered by the FASTWIND model grid are summarized in Table 2.
Parameter space covered by the grid FASTWIND models at SMC metallicity.
We did not perform stellar parameter determinations for the 30 Dor objects included in this study. Instead, we adopted the results from SS14, who determined the stellar parameters using the same approach employed here, based on the IACOB tools.
2.3.1. Stellar parameter determination
Projected rotational velocity (v sin i). The resolving power of our spectra (R ∼ 4100) and their limited wavelength coverage (4000–5000 Å) impose constraints on the precise characterization of line broadening in the sample. At this resolution, v sin i values below ∼75 km s−1 (approximately the resolution limit, c/R) are inherently uncertain. In cases where v sin i could not be reliably measured, we adopted a fixed value of 50 km s−1, following standard practice. This was applied to six O V and two O Vz stars.
Due to the general absence of metallic lines in our spectra, we relied primarily on He I lines to derive estimates of v sin i. We used He I λ4387 as a main diagnostic, as it is present in most stars and appropriate for this type of analysis. For a few stars where He I lines were weak or absent, we used He II λ4541 as an alternative. It is important to note that, according to Simón-Díaz & Herrero (2007), the Fourier Transform method implemented in the IACOB-BROAD tool yields consistent v sin i measurements in O-type stars using both He I and metallic lines.
While the use of these lines can pose challenges for accurately studying very slow rotators, as discussed in Ramírez-Agudelo et al. (2013), this limitation is less critical here due to the already restricted resolution of the data. Moreover, methodological approaches outlined in works such as Gray (2005) and Simón-Díaz et al. (2014) provide a robust framework for disentangling the effects of rotational broadening and macroturbulence in massive stars, even under these constraints.
Diagnostic lines. To perform the analysis, we initially considered the following set of spectral lines: Hδ, Hγ, Hβ, He I λ4387, He I λ4471, He I λ4713, He I λ4922, He II λ4200, He II λ4541, He II λ4686, and He I + He II λ4026. Each line was analyzed individually, with its corresponding spectral window automatically selected based on the respective synthetic profile.
The Hα line is a fundamental marker for characterizing stellar winds, particularly in relation to mass-loss rates and the wind structure in massive stars. However, in O-type stars of luminosity class V and Vz, stellar winds are weak, which makes the contribution of Hα less significant. Therefore, its absence in this analysis does not significantly impact the obtained results. Instead, the spectral characterization has focused on lines such as He I and He II, which are more relevant for these stars.
Effective Temperature (Teff), surface gravity (logg) and helium abundance (YHe). In our analysis, we adopted specific strategies to derive the stellar parameters. To do this, we selected initial values from previous estimates by Massey et al. (2005). Then, we calculated the chi-squared value by comparing the observed spectrum with the synthetic model at each point. During the iterative fitting process, the values of Teff, logg, Y(He), among other relevant parameters, were adjusted. The goal was to find the set of parameters that allows the synthetic model to best fit the observational data.
For most of the stars analyzed, estimates for these parameters, along with their formal uncertainties, were derived. However, in some cases, due to data limitations or the inherent complexities of stellar characteristics, only upper or lower limits could be established for these parameters. It is important to note that the values of logg and Teff are not independent, as adjusting one influences the other. Therefore, IACOB-GBAT optimizes both parameters, along with others, during the fitting process to obtain a solution that is consistent with the spectroscopicobservations.
Following previous studies (Herrero et al. 2002; Ramírez-Agudelo et al. 2017), helium abundance was treated as a free parameter in this work.
Wind parameter (logQ). The wind strength parameter for O V and O Vz stars is generally undetermined due to their weak winds. Additionally, the lack of precise terminal velocity (v∞) measurements introduces uncertainty when evaluating potential differences between O V and O Vz stars. Therefore, we focused on determining logQ directly from the spectroscopic analysis.
The spectroscopic determination of logQ typically relies on the Hα line, which is known to be highly sensitive to variations in mass-loss rate. However, in our case, the use of Hα is severely limited due to strong nebular contamination in the NGC 346 region. This contamination significantly alters the observed profile, making it unsuitable for a reliable assessment of stellar wind properties in our sample. Given this limitation, we based our analysis of logQ on the He II λ4686 line, which remains a valid diagnostic in this context. As discussed by Sabín-Sanjulián et al. (2014), the core flux of the He II λ4686 line is sensitive to variations in logQ, making it suitable for determining wind strength in O-type dwarfs.
Wind velocity exponent (β) and microturbulence (ξt). According to Holgado et al. (2018), the IACOB-GBAT analysis cannot provide reliable constraints for the wind velocity exponent, especially within the considered range of values (0.8 − 1.2). They also indicate that uncertainties in the logQ parameter are reduced when β is fixed. Therefore, we decided to set β = 1.0, a value commonly used in O-type star studies.
Following recent studies (Mokiem et al. 2005; Ramírez-Agudelo et al. 2017), we treat microturbulence as a free parameter in our spectroscopic analysis. Determining microturbulence in O-type stars is particularly challenging due to the limited number of suitable metallic lines available for diagnostic purposes, in contrast to B-type stars, which offer a richer set of metal lines (Holgado et al. 2018). Although He lines provide some insight, their diagnostic power is limited. Holgado et al. also showed that certain diagnostic line cores are sensitive to microturbulence through saturation effects; however, this sensitivity is generally weak in O-type stars, limiting the precision of derived values.
Microturbulence affects the shape of spectral lines, especially metallic ones. High microturbulence leads to slight saturation in the line cores, resulting in broader and more squared or flattened profiles. This effect arises because microturbulence introduces non-thermal motions in the stellar atmosphere, increasing absorption at the line center and modifying the intensity distribution (Repolust et al. 2004). In contrast, low microturbulence produces more triangular-shaped profiles, as absorption is less influenced by turbulent motions.
Sabín-Sanjulián et al. (2014) showed that the χ2 distribution for microturbulence is often degenerate, making it difficult to determine a unique value. In some cases, a slightly better fit is obtained with ξt = 5 km s−1, but overall, microturbulence cannot be reliably constrained for O-type stars and is therefore commonly treated as a free parameter, an approach we adopt in this study. While different values are tested during the fitting process, variations within the adopted range have minimal impact on the final stellar parameters (Villamariz & Herrero 2000).
3. Results
3.1. NGC 346
3.1.1. Spatial and spectral type distributions
Table 3 provides detailed information on the updated classifications, equivalent widths, and their associated errors for the NGC 346 sample. Likewise, Fig. 2 illustrates the spatial distribution of O-type stars in the same sample. The luminosity subclasses are represented by gray triangles for O V stars and orange circles for O Vz stars. Normal dwarfs (O V) dominate the sample, significantly outnumbering their Vz counterparts. The O Vz stars are grouped into two distinct regions: one in the southern part and another across the nebula. In contrast, O V stars are more widely distributed along the periphery, with some overlapping with the southern O Vz group.
Estimated equivalent widths (with their errors) of the spectral lines of He I and He II, along with the assigned parameter z to identify the spectral feature Vz in the analyzed stars in NGC 346.
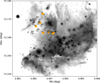 |
Fig. 2. Spatial distribution of O Vz stars (orange circles) and O V stars (gray triangles) analyzed in the NGC 346 region. Image Credit: NASA, ESA, CSA, N. Habel (JPL), P. Kavanagh (Maynooth University). |
Figure 3 shows the spectral type distribution of O-type stars in the NGC 346 sample. The upper panel shows the O Vz population (orange), while the lower panel represents the O V stars (gray). The normal dwarfs sample is dominated by mid- and late types, with a peak at spectral types O9 and O9.5 for the O V stars. In contrast, the O Vz stars are predominantly concentrated in intermediate spectral types between O5.5 and O8.5. The quantitative classification criterion applied in this study reveals that the O Vz stars constitute approximately ∼29% of the total sample, comprising eight objects. These stars are absent in later spectral types (> O8.5), consistent with prior findings. On the other hand, the O V stars, which represent ∼71% of the sample, are more evenly distributed across the spectral range but show a concentration in types later than O8.
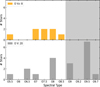 |
Fig. 3. Spectral distribution of O Vz (orange) and O V (gray) stars analyzed in the NGC 346 region. The gray dashed area represents the region defined by A16, where the Vz spectral feature is absent in stars with spectral later type than O8.5. |
3.1.2. Distribution of the projected rotational velocities
Figure 4 shows the distribution of projected rotational velocity v sin i [km s−1] for O V (gray diagonal lines) and O Vz (orange diagonal lines) stars. As explained in Section 2.3, for six O V and two O Vz stars where v sin i could not be reliably measured due to the resolution limit, a fixed value of 50 km s−1 was adopted.
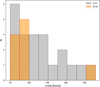 |
Fig. 4. Projected rotational velocity v sin i distribution of O Vz stars (orange diagonal lines) and O V stars (gray diagonal lines) analyzed in the NGC 346 region. |
The O V population shows a wide range of v sin i values, with a clear concentration below 100 km s−1, and a considerable fraction of stars extending toward higher rotational velocities (> 200 km s−1). In contrast, the O Vz stars are predominantly concentrated at lower velocities (v sin i < 100 km s−1), with only one object showing a higher value. While the overall distributions of O V and O Vz stars overlap significantly, the concentration of O Vz stars in the lower velocity range is noteworthy. However, the limited number of O Vz stars in the sample prevents a robust statistical comparison between the two populations. These differences, albeit tentative, could provide insights into the physical and evolutionary properties of thesesubclasses.
3.1.3. Effective temperatures and surface gravities
Figure 5 shows the distribution of the analyzed stars in the logg versus log Teff plane, plotting the ZAMS (green solid line), evolutionary tracks (blue solid lines), and isochrones (dashed lines) that cover ages up to 7 million years, based on the models of Brott et al. (2011). These models were calculated for the characteristic metallicity of the SMC and assuming an initial rotational velocity of 180 km s−1 (Dufton et al. 2019).
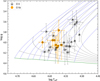 |
Fig. 5. Results of logg vs. log Teff for the O Vz and O V samples (orange circles and gray triangle symbols, respectively) in the NGC 346 region. |
As expected from their spectral-type distribution, O V stars show a broad dispersion in effective temperature, with values ranging from approximately 32 kK to 40 kK, with a peak frequency in 33 kK and 36 kK. In contrast, O Vz stars are constrained to a narrower range (37–40 kK) but overlap with O V stars in this interval.
Regarding surface gravities, O Vz stars are predominantly concentrated between logg ∼ 3.7 dex and logg ∼ 4.1 dex, clustering near logg ∼ 4.0 dex. O V stars, however, exhibit a broader range (logg ∼ 3.6 − 4.2 dex) with concentrations at both ends of the distribution. The absence of O Vz stars in regions of lower surface gravity (logg ∼ 3.6 dex) supports the hypothesis that these stars are less evolved and have not undergone significant expansion. However, the derived logg values reveal that O Vz stars are not systematically closer to the ZAMS than O V stars, challenging the assumption that higher gravities consistently distinguish the Vz subclass. This finding aligns with previous analyses (SS14), highlighting the need for further investigation into the physical properties that drive the classification ofO Vz stars.
3.1.4. Helium abundance
Figure 6 displays the helium abundance, Y(He), as a function of the effective temperature, Teff, for the NGC 346 sample. No systematic difference in helium abundance is observed between O V and O Vz stars. Both subclasses exhibit a comparable dispersion in Y(He), ranging from approximately 0.08 to 0.14, with significant variability within each spectral type.
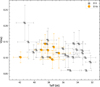 |
Fig. 6. Y(He) vs. Teff of O Vz stars (orange circles) and O V stars (gray triangles) analyzed in the NGC 346 region. |
Three stars –NGC 346-17, NGC 346-1034 and NGC 346-54– exhibit helium abundances that deviate significantly from theoretical predictions, with values Y(He) = 0.06, 0.06, and 0.21, respectively. These discrepancies may reflect complex physical conditions or highlight limitations in the modeling assumptions for these specific objects. Spectral fits assuming a fixed Y(He) = 0.10, consistent with the majority of the sample, proved unsatisfactory, emphasizing the need for furtherinvestigation.
3.1.5. Wind-strength Q parameter
To investigate the wind properties of the analyzed sample, Fig. 7 shows the derived logQ values as a function of effective temperature. The downward arrows indicate upper limits for logQ, highlighting degeneracies at lower values and the impossibility of precise determinations in these cases.
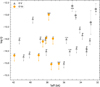 |
Fig. 7. Wind parameter logQ vs. Teff of O Vz stars (orange circles) and O V stars (gray triangles) analyzed in the NGC 346 region. |
O V and O Vz stars exhibit similar distributions in logQ with no clear separation between the two groups. The most negative values of logQ, which correspond to the weakest stellar winds, do not show a direct association with either class. This suggests that the observed dispersion likely reflects the intrinsic variability of wind properties across the sample rather than systematic differences between O V and O Vz stars.
3.1.6. The Hertzsprung-Russell diagram
In Fig. 8 we present the Hertzsprung-Russell (HR) diagram for the NGC 346 region. The ZAMS (solid green line), evolutionary tracks (solid blue lines), and isochrones (dotted lines) are the same as those shown in Fig. 5. The luminosities were determined following the methodology proposed by Hunter et al. (2007), using V-band magnitudes estimated by Massey et al. (1989). Due to the low extinction toward the Magellanic Clouds, a single reddening value for NGC 346 was adopted, as suggested by Dufton et al. (2019). The reddening law by Bouchet et al. (1985) was used, expressed AV = 2.72 E(B−V), with a constant reddening value of E(B−V) = 0.09 (Massey et al. 1989). Bolometric corrections from Vacca et al. (1996) were applied, assuming a distance modulus of 18.91 (Cignoni et al. 2010).
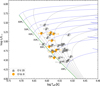 |
Fig. 8. Hertzsprung-Russell diagram for O Vz (orange circles) and O V (gray triangles) stars analyzed in the NGC 346 region. |
The diagram reveals a sparsely populated region above the upper ZAMS, with no stars younger than 1 Myr and hotter than 40 kK, suggesting a dearth of very massive stars. These findings are consistent with the recent analysis by Rickard et al. (2022), who also noted a deficiency of O-type stars on the ZAMS and in the upper region of the HR diagram, based on a sample of 18 O-type stars with luminosity class V and 3 with luminosity classes II–III. Regarding ages, most stars in the 28–35 M⊙ mass range exhibit values between 1 and 4 Myr, with minimal dispersion, while stars with masses below 25 M⊙ show a broader age range, spanning from 1 to 6 Myr. Notably, the ages of O Vz stars and O V stars show no systematic differences, once again calling into question the potential link between the Vz classification and a younger evolutionary stage.
3.2. 30 Doradus revisited
3.2.1. Spectral reclassification
The O V and O Vz stars in 30 Doradus were reclassified using the quantitative criterion proposed by A16, which is more restrictive than the purely morphological approach employed by SS14. The quantitative method was designed to minimize the inclusion of marginal cases and provide a more robust classification based on the equivalent widths of specific helium lines. Table B.2 provides information on the equivalent widths and their errors for this region.
Applying this updated criterion resulted in a slightly different distribution of O V and O Vz stars compared to SS14. Specifically, our results indicate a reduction of approximately 12% in the number of O Vz stars, with 28 stars now classified as O Vz (compared to 38 in SS14) and 56 as O V (compared to 46 in SS14). O Vz stars represent 33% of the total sample. Despite this quantitative difference, the overall trends remain qualitatively consistent: O Vz stars are less numerous than O V stars and are distributed throughout the region, with no evident spatial differences between the two groups, as shown in Fig. 9.
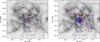 |
Fig. 9. Spatial distribution of O Vz (red circles) and O V (blue triangles) stars analyzed in the 30 Doradus region by Sabín-Sanjulián et al. (2014) (left panel) and this work (right panel). |
In Fig. 10, the spectral type distributions of O V and O Vz stars are compared. Our findings confirm that O Vz stars are most common in intermediate spectral types (O5–O7), while O V stars dominate later spectral types. The application of the quantitative classification criterion results in a spectral distribution that is more astrophysically consistent: O Vz stars are fewer in number than O V stars, as expected from the shorter timescales associated with the Vz phenomenon, and no O Vz stars are found at late spectral types, in agreement with theoretical predictions.
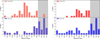 |
Fig. 10. Spectral distribution of O Vz (red) and O V (blue) stars analyzed in the 30 Doradus region by Sabín-Sanjulián et al. (2014) (left panel) and this study (right panel). The gray dashed area corresponds to the one defined by A16, as shown in Fig. 3. |
3.2.2. Comparison of the Hertzsprung-Russell diagrams
Figure 11 presents two HR diagrams for 30 Doradus: the left panel shows the results based on the morphological classifications of SS14, while the right panel depicts a reconstruction using the updated spectral classifications derived in this study. Both diagrams reveal similar overall distributions. O Vz stars (red circles) are concentrated at higher effective temperatures (Teff ≥ 35 000 K) and, in general, are located closer to ZAMS. In contrast, O V stars (blue triangles) occupy a broader range in the HR diagram, extending toward cooler (Teff ≤ 35 000 K) and more evolved regions. In both cases, a transition from O Vz to O V is observed as stars begin to develop stronger stellar winds, consistent with the evolutionary models of massivestars.
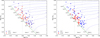 |
Fig. 11. Hertzsprung-Russell diagram for the O Vz and O V samples in 30 Doradus (represented by red circles and blue triangle symbols, respectively), analyzed by Sabín-Sanjulián et al. (2014) (left panel) and in this study (right panel). Zone 1: Teff ≤ 35 000 K. Zone 2: 35 000 K ≤ Teff ≤ 40 000 K. Zone 3: Teff ≥ 40 000 K). |
However, differences are apparent in the number of O Vz stars found at advanced evolutionary stages. The SS14 classifications include 16 O Vz stars with ages exceeding 2 Myr (see Table 4 from SS14), whereas the stricter classification criteria employed in this study result in only 10 such stars. This aligns more closely with the hypothesis that O Vz stars represent a younger population within theO V class.
In any case, while the refined classification reduces the presence of O Vz stars with advanced ages in about a 37%, the Vz phenomenon still appears to persist for a longer duration in 30 Doradus compared to the Galaxy. As suggested by SS14, this extended persistence may be linked to the lower metallicity of the LMC. Following this reasoning, O Vz stars with ages exceeding 2 Myr could be expected to be more prevalent in the even lower-metallicity environment of the SMC.
4. Discussion
In this study we investigated the O-type stars of luminosity classes V and Vz within the star-forming region NGC 346 in the SMC. Our analysis focused on comparing the physical and evolutionary properties of these two subclasses, drawing parallels with previous work in the 30 Doradus region (SS14). Below, we discuss our main findings and their implications.
Proportion of O Vz stars in NGC 346. Out of a sample of 28 O-type stars of class V in NGC 346, 8 were identified as belonging to the Vz subclass, corresponding to 29% of the sample. This proportion is consistent with the 33% found in 30 Doradus after the spectral reclassification based on quantitative criteria. In the MW, the systematic investigation of the Galactic O Vz stars conducted by Arias et al. (2016) identified 78 O Vz stars out of a total of 197 class V objects with spectral types between O3 and O8.5, corresponding to 39% of the sample. However, comparing the MW as a whole with the specific star-forming regions of the Magellanic Clouds introduces complications, given the heterogeneity of environments within the Galaxy. A more appropriate comparison would involve regions with similar characteristics, such as the massive star-forming cluster NGC 3603.
NGC 3603 hosts a rich population of O-type stars, making it an excellent candidate for such comparative studies. Although some spectroscopic studies of the massive stellar population in NGC 3603 exist (e.g., Melena et al. 2008), none have specifically focused on characterizing the O-type class V stars, or investigating the presence of Vz stars. This represents an opportunity to explore the physical and evolutionary properties of these stars in a Galactic environment that shares similarities with 30 Doradus and NGC 346. We aim to address such comparison in a forthcoming study.
Comparison between O V and O Vz stars in NGC 346. The quantitative spectroscopic analysis of the NGC 346 sample reveals some differences between O V and O Vz stars, although these are insufficient to establish clear distinctions in terms of evolutionary status. Notably, no systematic differences are observed in the wind strength parameter logQ, which would be expected from the stronger He II λ4686 absorption indicative of a potentially lower mass-loss rate. Similarly, no significant differences in helium abundance are observed between the two subclasses. Finally, O Vz stars do not exhibit systematically lower luminosities or higher gravities, which would be expected if they were exclusively younger objects nearer to the ZAMS (see the HR diagram in Fig. 8). These findings are consistent with the results of SS14 for 30 Doradus, supporting the hypothesis that the Vz classification is not a direct evolutionary status indicator, but arises from specific combinations of physical parameters.
The lack of clear evolutionary distinctions between O V and O Vz stars confirms that the Vz phenomenon results from a complex interplay of physical parameters, including effective temperature, surface gravity, the wind strength parameter and the projected rotational velocity. As demonstrated by SS14, variations in these four parameters affect the relative intensities of the He lines relevant to the Vz classification. As a result, stars classified as Vz may not necessarily represent a homogeneous or distinct group but rather a subset of O-type stars that happen to fall within a specific parameter space at the time of observation.
Metallicity and the extended Vz phase. SS14 proposed an explanation for the large number of O Vz stars found in 30 Doradus and their unexpected presence at significant distances from the ZAMS. They hypothesized that the low metal content of the LMC implies weaker stellar winds, preventing most O dwarfs, even relatively evolved, from breaking the Vz characteristic. In this context, fewer Vz stars would be expected away from the ZAMS in the MW, where higher metallicity strengthens stellar winds and accelerates the loss of the Vz characteristic. Extending this reasoning to the SMC, with its even lower metallicity, a greater proportion of O Vz stars with advanced ages might be expected.
Our findings suggest a potential correlation between metallicity and the duration of the Vz phase. In NGC 346, where the metallicity is approximately 0.4 times that of 30 Doradus, 50% of the O Vz stars have ages exceeding 2 Myr, and 38% are older than 3 Myr. In contrast, only 11% of O Vz stars in 30 Doradus surpass 3 Myr. For comparison, the Galactic sample studied by Holgado et al. (2020) includes only one O Vz star older than 3 Myr out of a total of 32 stars. Although the size of our sample is very limited, this trend supports the hypothesis that lower metallicity extends the Vz phase by weakening stellar winds. The importance of stellar wind strength in shaping the observable properties of O stars is thus reinforced.
The absence of very massive stars near the ZAMS. The absence of very massive stars near the ZAMS is a topic of active discussion in stellar astrophysics. In an extensive study of Galactic O-type stars, Holgado et al. (2020) identified a dearth of ZAMS objects in the mass range of approximately 30–70 M⊙. The authors demonstrated that this gap persists even after accounting for potential observational biases, such as extinction by the parental cloud. Similar findings have been reported in the Magellanic Clouds. For instance, Schootemeijer et al. (2021) used a combination of spectral types from catalogs and Gaia magnitudes to report a dearth of young and bright massive stars in the SMC. Schneider et al. (2018) identified in 30Doradus a sparsely occupied region in the HR diagram between the ZAMS, the 1Myr isochrone, and the 30 M⊙ stellar track among the OB population from the VFTS survey. This fact is also apparent in Fig. 11.
In our study of NGC 346, no stars within the 1 Myr isochrone are observed above the 25 M⊙ evolutionary track in the HR diagram, except for star NGC 346-54 (see Fig. 8). This result aligns with the trends reported for other regions but must be interpreted with caution given the small and likely incomplete sample analyzed here. The challenges posed by distance, crowding, and extinction in NGC 346 may contribute to the observed gap, highlighting the need for more comprehensive studies with larger datasets.
5. Summary and outlook
In this study, we conducted a detailed spectroscopic analysis of O V and O Vz stars in NGC 346, the most O-star-rich star-forming region in the SMC. O Vz stars are particularly intriguing, as they have been hypothesized to represent a less evolved subgroup among the youngest optically visible massive stars. Using intermediate-resolution spectra obtained with the MagE spectrograph, complemented by public FLAMES data, we updated the spectral classifications of 37 stars and determined their physical parameters.
Our results indicate that the differences exhibited by O Vz stars in NGC 346 are insufficient to establish them as systematically younger or closer to the ZAMS compared to O V stars, consistent with previous findings in 30 Doradus. We confirm that the Vz classification is not a reliable indicator of evolutionary age but instead appears to result from a specific combination of stellar parameters. Nonetheless, the role of wind properties influenced by low-metallicity environments could be particularly significant. In this context, our findings suggest that the duration of the Vz phase may be correlated with metallicity, with stars in the SMC exhibiting this characteristic for longer periods due to their weaker stellar winds.
As we have mentioned throughout the discussion section, the primary limitation of this study is the small sample size. The challenges posed by NGC 346 – such as its distance and crowding – complicate the identification, classification, and detailed spectroscopic analysis of its stellar population. Another limitation is the relatively low resolution of the MagE spectra, which restricts the precision with which we can derive key stellar parameters. These limitations constrain the significance of our analyisys, highlighting the need for more comprehensive datasets.
Future surveys, such as those conducted under the ULLYSES program (Roman-Duval et al. 2020), hold great promise for addressing these challenges. A key component is the X-Shooting ULLYSES subprogram (Vink et al. 2023), which uses the X-Shooter instrument on the VLT to obtain optical to near-infrared spectra of the ULLYSES sample. These data are particularly suitable for the detailed characterization of massive stars. While our study represents an initial step toward understanding the role of metallicity in the O Vz phenomenon, X-Shooting ULLYSES observations of NGC 346 will offer a broader perspective on these stars, helping to refine and expand our conclusions.
Acknowledgments
We thank the referee for their constructive comments, which helped improve the clarity of this work. This research is part of the Ph.D. thesis of L. Arango and is supported by the Agencia Nacional de Investigación y Desarrollo (ANID) through the Chilean National Doctoral Fellowship No. 21221152. We also acknowledge financial support from the Chilean Astronomical Society (SOCHIAS). J. I. A acknowledges the financial support from the Dirección de Investigación y Desarrollo de la Universidad de La Serena (ULS), through the project PR2324063. G. H acknowledges support from the Spanish Ministry of Science and Innovation and Universities (MICIU) through the Spanish State Research Agency (AEI) through grants PID2021-122397NB-C21, PID2022-136640NB-C22, 10.13039/501100011033, and the Severo Ochoa Program 2020-2023 (CEX2019-000920-S).
References
- Antoniou, V., Zezas, A., Drake, J. J., et al. 2019, ApJ, 887, 20 [NASA ADS] [CrossRef] [Google Scholar]
- Apellániz, J. M., Sota, A., Arias, J. I., et al. 2016, ApJS, 224, 4 [CrossRef] [Google Scholar]
- Arias, J. I., Walborn, N. R., Díaz, S. S., et al. 2016, AJ, 152, 31 [NASA ADS] [CrossRef] [Google Scholar]
- Bestenlehner, J. M., Vink, J. S., Gräfener, G., et al. 2011, A&A, 530, L14 [NASA ADS] [CrossRef] [EDP Sciences] [Google Scholar]
- Bestenlehner, J. M., Gräfener, G., Vink, J. S., et al. 2014, A&A, 570, A38 [NASA ADS] [CrossRef] [EDP Sciences] [Google Scholar]
- Bouchet, P., Lequeux, J., Maurice, E., Prevot, L., & Prevot-Burnichon, M. 1985, A&A, 149, 330 [NASA ADS] [Google Scholar]
- Bouret, J.-C., Lanz, T., Hillier, D., et al. 2003, ApJ, 595, 1182 [NASA ADS] [CrossRef] [Google Scholar]
- Brott, I., de Mink, S. E., Cantiello, M., et al. 2011, A&A, 530, A115 [NASA ADS] [CrossRef] [EDP Sciences] [Google Scholar]
- Cignoni, M., Tosi, M., Sabbi, E., Nota, A., & Gallagher, J. 2010, AJ, 141, 31 [Google Scholar]
- Crowther, P. A. 2010, in The Impact of HST on European Astronomy. Ap&SS Proceedings (Springer), 3 [Google Scholar]
- Dufton, P., Evans, C., Hunter, I., Lennon, D., & Schneider, F. 2019, A&A, 626, A50 [NASA ADS] [CrossRef] [EDP Sciences] [Google Scholar]
- Ekström, S., Georgy, C., Eggenberger, P., et al. 2012, A&A, 537, A146 [Google Scholar]
- Evans, C., Lennon, D., Smartt, S., & Trundle, C. 2006, A&A, 456, 623 [CrossRef] [EDP Sciences] [Google Scholar]
- Evans, C., Taylor, W., Sana, H., et al. 2011, Messenger, 145, 33 [Google Scholar]
- Gray, D. F. 2005, The Observation and Analysis of Stellar Photospheres, 3rd edn. (Cambridge, UK: Cambridge University Press) [Google Scholar]
- Hawcroft, C., Sana, H., Mahy, L., et al. 2024, A&A, 688, A105 [NASA ADS] [CrossRef] [EDP Sciences] [Google Scholar]
- Herrero, A., Puls, J., & Najarro, F. 2002, A&A, 396, 949 [CrossRef] [EDP Sciences] [Google Scholar]
- Heydari-Malayeri, M., & Selier, R. 2010, A&A, 517, A39 [NASA ADS] [CrossRef] [EDP Sciences] [Google Scholar]
- Holgado, G., Simón-Díaz, S., Barbá, R. H., et al. 2018, A&A, 613, A65 [NASA ADS] [CrossRef] [EDP Sciences] [Google Scholar]
- Holgado, G., Simón-Díaz, S., Haemmerlé, L., et al. 2020, A&A, 638, A157 [NASA ADS] [CrossRef] [EDP Sciences] [Google Scholar]
- Hunter, I., Dufton, P., Smartt, S., et al. 2007, A&A, 466, 277 [NASA ADS] [CrossRef] [EDP Sciences] [Google Scholar]
- Kudritzki, R.-P., & Puls, J. 2000, ARA&A, 38, 613 [Google Scholar]
- Lamb, J., Oey, M., Segura-Cox, D., et al. 2016, VizieR On-line Data Catalog: J/ApJ/817/113 [Google Scholar]
- Langer, N. 2012, ARA&A, 50, 107 [CrossRef] [Google Scholar]
- Lucy, L. 2012, A&A, 543, A18 [NASA ADS] [CrossRef] [EDP Sciences] [Google Scholar]
- Marshall, J., Burles, S., Thompson, I. B., et al. 2008, in Ground-based and Airborne Instrumentation for Astronomy II (SPIE), 7014, 1777 [Google Scholar]
- Massey, P., Parker, J. W., & Garmany, C. D. 1989, AJ, 98, 1305 [Google Scholar]
- Massey, P., Puls, J., Pauldrach, A., et al. 2005, ApJ, 627, 477 [NASA ADS] [CrossRef] [Google Scholar]
- Melena, N. W., Massey, P., Morrell, N. I., & Zangari, A. M. 2008, AJ, 135, 878 [NASA ADS] [CrossRef] [Google Scholar]
- Mokiem, M. R., De Koter, A., Puls, J., et al. 2005, A&A, 441, 711 [NASA ADS] [CrossRef] [EDP Sciences] [Google Scholar]
- Mokiem, M., de Koter, A., Evans, C., et al. 2006, A&A, 456, 1131 [NASA ADS] [CrossRef] [EDP Sciences] [Google Scholar]
- Niemela, V. S., Marraco, H. G., & Cabanne, M. L. 1986, PASP, 98, 1133 [NASA ADS] [CrossRef] [Google Scholar]
- Parker, J. W., Garmany, C. D., Massey, P., & Walborn, N. R. 1992, AJ, 103, 1205 [NASA ADS] [CrossRef] [Google Scholar]
- Puls, J., Kudritzki, R.-P., Herrero, A., et al. 1996, A&A, 305, 171 [NASA ADS] [Google Scholar]
- Puls, J., Urbaneja, M., Venero, R., et al. 2005, A&A, 435, 669 [NASA ADS] [CrossRef] [EDP Sciences] [Google Scholar]
- Puls, J., Vink, J. S., & Najarro, F. 2008, A&ARv, 16, 173 [Google Scholar]
- Ramírez-Agudelo, O., Simón-Díaz, S., Sana, H., et al. 2013, A&A, 560, A29 [NASA ADS] [CrossRef] [EDP Sciences] [Google Scholar]
- Ramírez-Agudelo, O., Sana, H., de Koter, A., et al. 2017, A&A, 600, A81 [NASA ADS] [CrossRef] [EDP Sciences] [Google Scholar]
- Repolust, T., Puls, J., & Herrero, A. 2004, A&A, 415, 349 [NASA ADS] [CrossRef] [EDP Sciences] [Google Scholar]
- Rickard, M., Hainich, R., Hamann, W.-R., et al. 2022, A&A, 666, A189 [NASA ADS] [CrossRef] [EDP Sciences] [Google Scholar]
- Roman-Duval, J., Proffitt, C. R., Taylor, J. M., et al. 2020, Res. Notes Am. Astron. Soc., 4, 205 [Google Scholar]
- Sabín-Sanjulián, C., Simón-Díaz, S., Herrero, A., et al. 2014, A&A, 564, A39 [NASA ADS] [CrossRef] [EDP Sciences] [Google Scholar]
- Salpeter, E. E. 1955, ApJ, 121, 161 [Google Scholar]
- Santolaya-Rey, A., Puls, J., & Herrero, A. 1997, A&A, 323, 488 [Google Scholar]
- Schneider, F., Ramírez-Agudelo, O., Tramper, F., et al. 2018, A&A, 618, A73 [NASA ADS] [CrossRef] [EDP Sciences] [Google Scholar]
- Schootemeijer, A., Langer, N., Lennon, D., et al. 2021, A&A, 646, A106 [NASA ADS] [CrossRef] [EDP Sciences] [Google Scholar]
- Simón-Díaz, S., & Herrero, A. 2007, A&A, 468, 1063 [NASA ADS] [CrossRef] [EDP Sciences] [Google Scholar]
- Simón-Díaz, S., & Herrero, A. 2014, A&A, 562, A135 [NASA ADS] [CrossRef] [EDP Sciences] [Google Scholar]
- Simón-Díaz, S., Castro, N., Herrero, A., et al. 2011, J. Phys.: Conf. Ser., 328, 012021 [Google Scholar]
- Simón-Díaz, S., Herrero, A., Sabín-Sanjulián, C., et al. 2014, A&A, 570, L6 [NASA ADS] [CrossRef] [EDP Sciences] [Google Scholar]
- Skiff, B. 2009, VizieR On-line Data Catalog: B/mk [Google Scholar]
- Smith Neubig, M. M., & Bruhweiler, F. C. 1997, AJ, 114, 1951 [CrossRef] [Google Scholar]
- Sota, A., Apellániz, J. M., Walborn, N. R., et al. 2011, ApJS, 193, 24 [NASA ADS] [CrossRef] [Google Scholar]
- Sota, A., Apellániz, J. M., Barbá, R. H., et al. 2013, Highlights of Spanish Astrophysics VII, 672 [Google Scholar]
- Sota, A., Apellániz, J. M., Morrell, N. I., et al. 2014, ApJS, 211, 10 [NASA ADS] [CrossRef] [Google Scholar]
- Tody, D. 1993, in Astronomical Data Analysis Software and Systems II, 52, 173 [Google Scholar]
- Vacca, W. D., Garmany, C. D., & Shull, J. M. 1996, ApJ, 460, 914 [NASA ADS] [CrossRef] [Google Scholar]
- Villamariz, M., & Herrero, A. 2000, A&A, 261, 597 [Google Scholar]
- Vink, J. S. 2017, Philos. Trans. R. Soc. A, 375, 20160269 [Google Scholar]
- Vink, J. S., Mehner, A., Crowther, P. A., et al. 2023, A&A, 675, A154 [NASA ADS] [CrossRef] [EDP Sciences] [Google Scholar]
- Wade, G., & Neiner, C. 2017, arXiv e-prints [arXiv:1712.09747] [Google Scholar]
- Walborn, N. R. 1973, ApJ, 179, 517 [NASA ADS] [CrossRef] [Google Scholar]
- Walborn, N. R., & Blades, J. C. 1997, ApJS, 112, 457 [Google Scholar]
- Walborn, N. R., & Parker, J. W. 1992, ApJ, 399, L87 [NASA ADS] [CrossRef] [Google Scholar]
- Walborn, N. R., Lennon, D. J., Heap, S. R., et al. 2000, PASP, 112, 1243 [Google Scholar]
- Walborn, N., Sana, H., Simón-Díaz, S., et al. 2014, A&A, 564, A40 [NASA ADS] [CrossRef] [EDP Sciences] [Google Scholar]
- Walder, R., Folini, D., & Meynet, G. 2012, Space Sci. Rev., 166, 145 [NASA ADS] [CrossRef] [Google Scholar]
Appendix A: Spectral classification
The determination of spectral types and luminosity classes for the stars in NGC 346 was carried out using a comparative approach. This involved a qualitative assessment in which the observed spectra were compared with the standards from the Galactic O-Star Spectroscopic Survey (GOSSS, Sota et al. 2011, 2014), applying the criteria established in the catalog. Despite the limitations imposed by the spectral resolution of the instrument, the visual method proved to be suitable even for spectra with low to moderate S/N, allowing for a reliable classification in most cases (Melena et al. 2008).
It is important to highlight that the resolving power of the stellar sample in NGC 346 (R ∼ 4100) is larger than that GOSSS classification atlas (R ∼ 2500). Consequently, the resolution of the spectra in the Magellanic Cloud region was degraded using the IRAF environment to properly interpret the spectral characteristics and apply the standard spectral classification for O-type stars, as outlined in the atlas. The degradation was carried out considering that the internal spectral resolution per pixel of the GOSSS survey corresponds to 0.7956 Å/pixel.
We have identified five previously unclassified stars in the cluster (see Fig. A.1). The new spectral types we have assigned are listed in Table A.1.
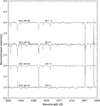 |
Fig. A.1. Normalized spectra of newly classified dwarfs in NGC 346. |
NGC 346 stars with newly classified spectral types.
Appendix B: Tables
NGC 346 stars.
Estimated equivalent widths (with their errors) of the spectral lines of He I and He II, along with the assigned parameter z to identify the spectral feature Vz in the analyzed stars in 30 Doradus.
Stellar and wind parameters obtained from the quantitative analysis of our sample.
Appendix C: Figures
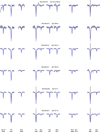 |
Fig. C.1. Observed spectra (gray) and best fitting model (blue) comparison for the main diagnostic lines. The sample is sorted following Table B.3. |
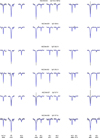 |
Fig. C.1. continued. |
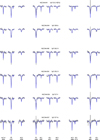 |
Fig. C.1. continued. |
 |
Fig. C.1. continued. |
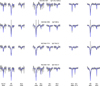 |
Fig. C.1. continued. |
All Tables
Estimated equivalent widths (with their errors) of the spectral lines of He I and He II, along with the assigned parameter z to identify the spectral feature Vz in the analyzed stars in NGC 346.
Estimated equivalent widths (with their errors) of the spectral lines of He I and He II, along with the assigned parameter z to identify the spectral feature Vz in the analyzed stars in 30 Doradus.
Stellar and wind parameters obtained from the quantitative analysis of our sample.
All Figures
|
Fig. 1. Comparison between our sample (orange bars) of O-type stars with luminosity class V in NGC 346 and those previously reported in the literature (Skiff 2009, blue bars). The green bars represent the number of stars common to both samples. For each spectral subtype, the percentages indicate the fraction of stars in the Skiff catalogue that are also present in our sample. |
| In the text | |
|
Fig. 2. Spatial distribution of O Vz stars (orange circles) and O V stars (gray triangles) analyzed in the NGC 346 region. Image Credit: NASA, ESA, CSA, N. Habel (JPL), P. Kavanagh (Maynooth University). |
| In the text | |
|
Fig. 3. Spectral distribution of O Vz (orange) and O V (gray) stars analyzed in the NGC 346 region. The gray dashed area represents the region defined by A16, where the Vz spectral feature is absent in stars with spectral later type than O8.5. |
| In the text | |
|
Fig. 4. Projected rotational velocity v sin i distribution of O Vz stars (orange diagonal lines) and O V stars (gray diagonal lines) analyzed in the NGC 346 region. |
| In the text | |
|
Fig. 5. Results of logg vs. log Teff for the O Vz and O V samples (orange circles and gray triangle symbols, respectively) in the NGC 346 region. |
| In the text | |
|
Fig. 6. Y(He) vs. Teff of O Vz stars (orange circles) and O V stars (gray triangles) analyzed in the NGC 346 region. |
| In the text | |
|
Fig. 7. Wind parameter logQ vs. Teff of O Vz stars (orange circles) and O V stars (gray triangles) analyzed in the NGC 346 region. |
| In the text | |
|
Fig. 8. Hertzsprung-Russell diagram for O Vz (orange circles) and O V (gray triangles) stars analyzed in the NGC 346 region. |
| In the text | |
|
Fig. 9. Spatial distribution of O Vz (red circles) and O V (blue triangles) stars analyzed in the 30 Doradus region by Sabín-Sanjulián et al. (2014) (left panel) and this work (right panel). |
| In the text | |
|
Fig. 10. Spectral distribution of O Vz (red) and O V (blue) stars analyzed in the 30 Doradus region by Sabín-Sanjulián et al. (2014) (left panel) and this study (right panel). The gray dashed area corresponds to the one defined by A16, as shown in Fig. 3. |
| In the text | |
|
Fig. 11. Hertzsprung-Russell diagram for the O Vz and O V samples in 30 Doradus (represented by red circles and blue triangle symbols, respectively), analyzed by Sabín-Sanjulián et al. (2014) (left panel) and in this study (right panel). Zone 1: Teff ≤ 35 000 K. Zone 2: 35 000 K ≤ Teff ≤ 40 000 K. Zone 3: Teff ≥ 40 000 K). |
| In the text | |
|
Fig. A.1. Normalized spectra of newly classified dwarfs in NGC 346. |
| In the text | |
|
Fig. C.1. Observed spectra (gray) and best fitting model (blue) comparison for the main diagnostic lines. The sample is sorted following Table B.3. |
| In the text | |
|
Fig. C.1. continued. |
| In the text | |
|
Fig. C.1. continued. |
| In the text | |
|
Fig. C.1. continued. |
| In the text | |
|
Fig. C.1. continued. |
| In the text | |
Current usage metrics show cumulative count of Article Views (full-text article views including HTML views, PDF and ePub downloads, according to the available data) and Abstracts Views on Vision4Press platform.
Data correspond to usage on the plateform after 2015. The current usage metrics is available 48-96 hours after online publication and is updated daily on week days.
Initial download of the metrics may take a while.