Open Access
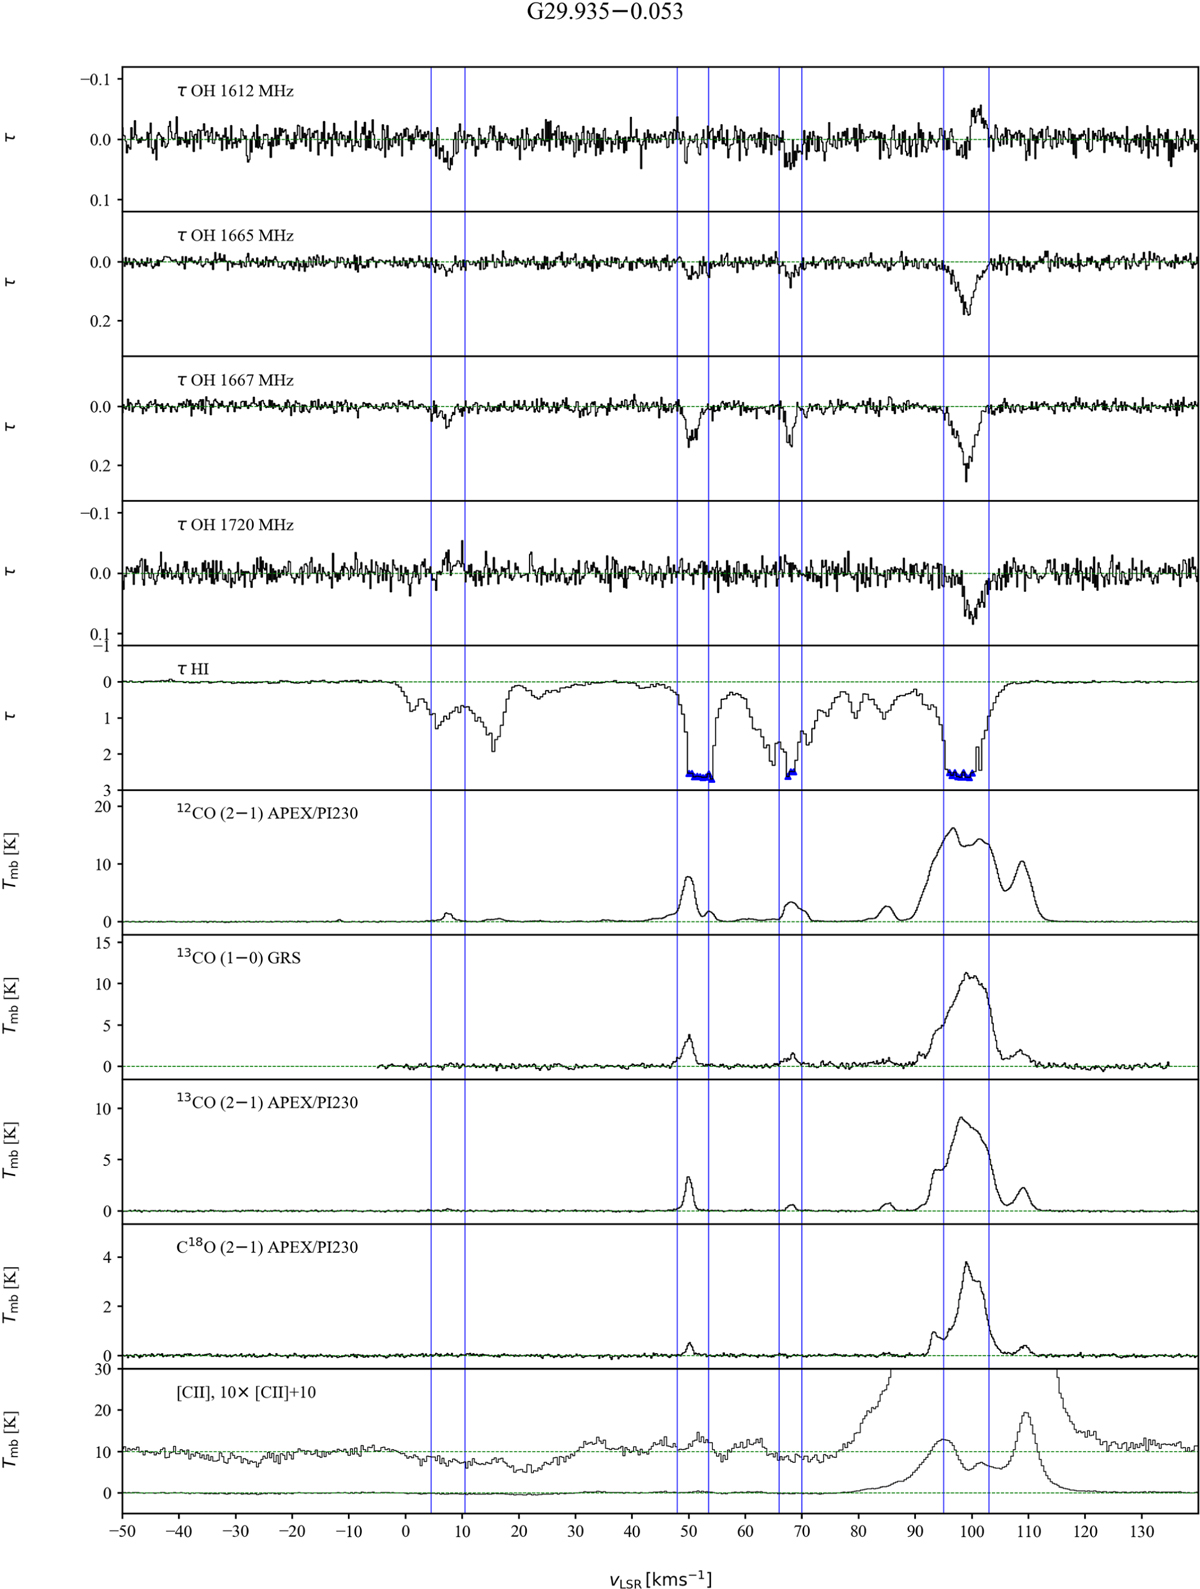
Fig. A.3
Download original image
Same as Fig. 2, but for G29.935-0.053. The bottom panel includes an enlarged view of the [C II] 158 µm line for better visibility of the faint emission or absorption components, and/or baseline ripples.
Current usage metrics show cumulative count of Article Views (full-text article views including HTML views, PDF and ePub downloads, according to the available data) and Abstracts Views on Vision4Press platform.
Data correspond to usage on the plateform after 2015. The current usage metrics is available 48-96 hours after online publication and is updated daily on week days.
Initial download of the metrics may take a while.