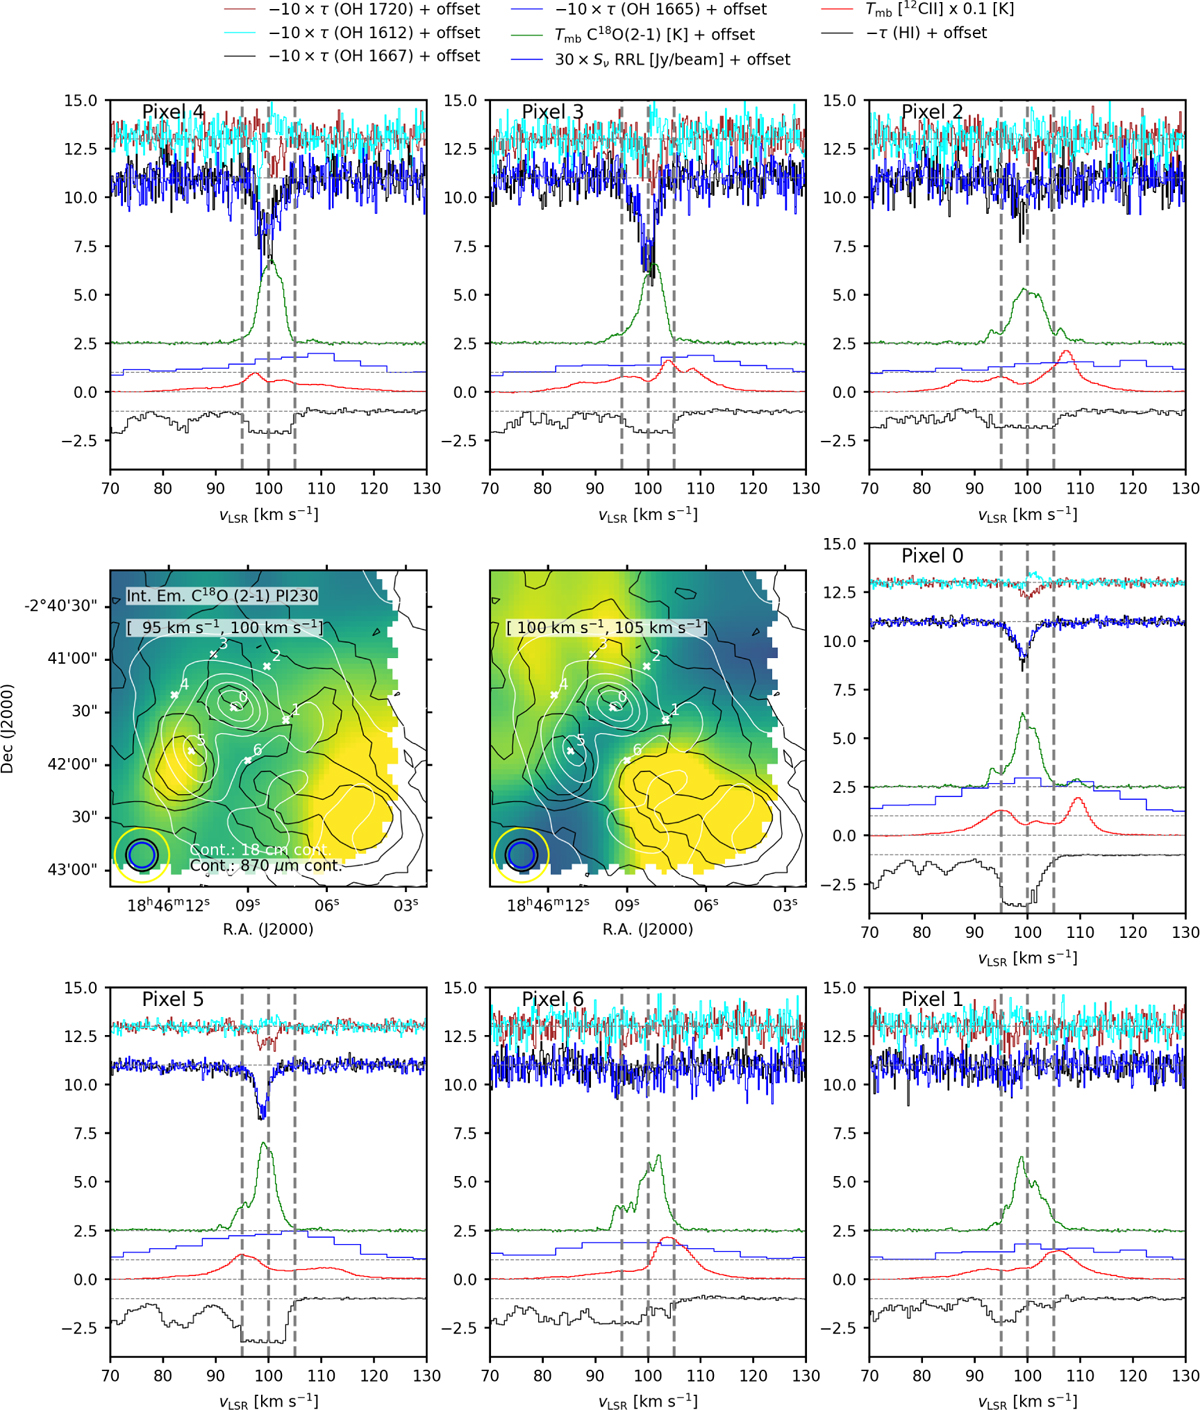
Fig. A.5
Download original image
Optical depth of the OH lines at 1612, 1665, 1667 and 1720 MHz, as well of H I toward the seven pixels toward G29.935-0.053 of the upGREAT/SOFIA [12C II] observations, as well as accompanying C18O (2–1) (APEX/PI230) and stacked radio recombination lines (40″, GLOSTAR; Brunthaler et al. 2021; Khan et al. 2024). The maps in the middle panel are repeated for clarity from row 2 in Fig. 7.
Current usage metrics show cumulative count of Article Views (full-text article views including HTML views, PDF and ePub downloads, according to the available data) and Abstracts Views on Vision4Press platform.
Data correspond to usage on the plateform after 2015. The current usage metrics is available 48-96 hours after online publication and is updated daily on week days.
Initial download of the metrics may take a while.