Fig. 2
Download original image
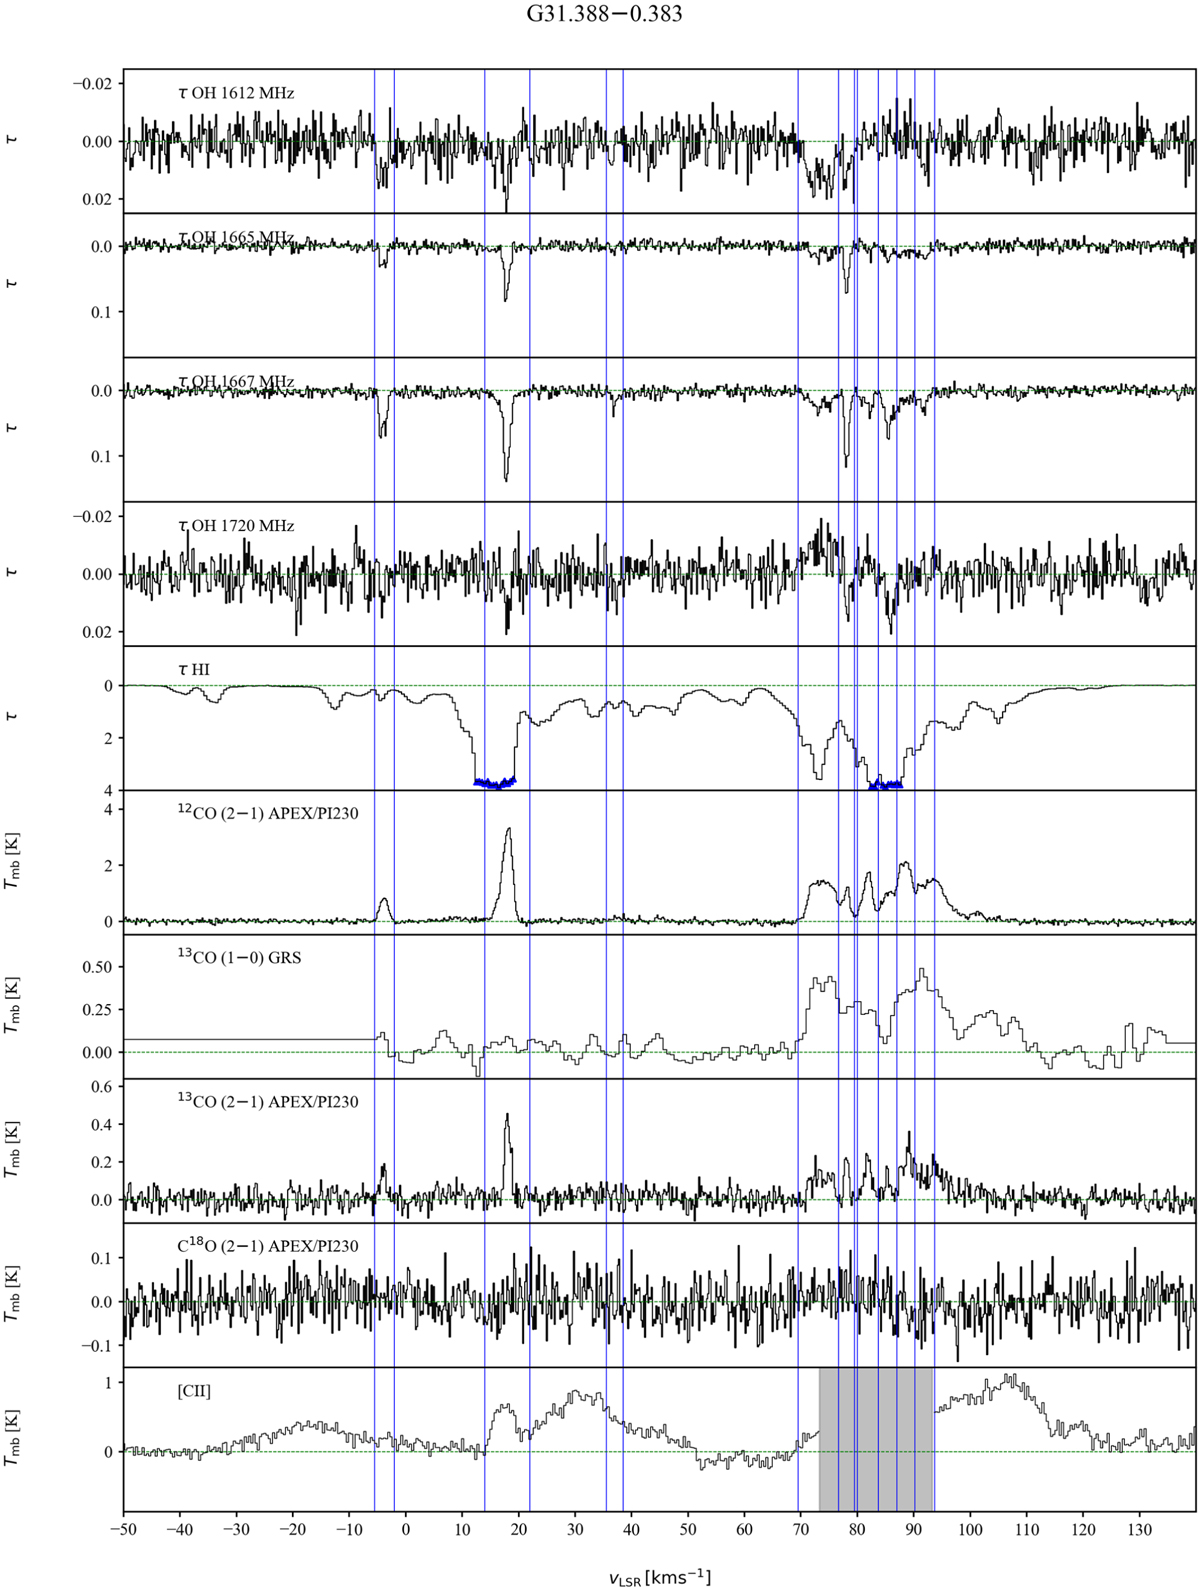
OH and H I absorption toward the extragalactic source G31.388-0.383. The first five panels show optical depths of the four OH lines and H I, as derived from the line-to-continuum ratio. For the H I absorption, blue triangles indicate saturated channels. Emission spectra of the three CO isotopologs are shown below that. The data was taken with APEX and from the GRS (Jackson et al. 2006) survey. The lowest panel displays the SOFIA/upGREAT observations of the [C II] 158 µm line. Integration limits are shown as blue vertical lines. To emphasize that the OH and the H I lines were observed toward strong background sources, and are – with the exception of stimulated emission – seen in absorption, the axis of the optical depth is inverted, i.e., goes from positive to negative values.
Current usage metrics show cumulative count of Article Views (full-text article views including HTML views, PDF and ePub downloads, according to the available data) and Abstracts Views on Vision4Press platform.
Data correspond to usage on the plateform after 2015. The current usage metrics is available 48-96 hours after online publication and is updated daily on week days.
Initial download of the metrics may take a while.