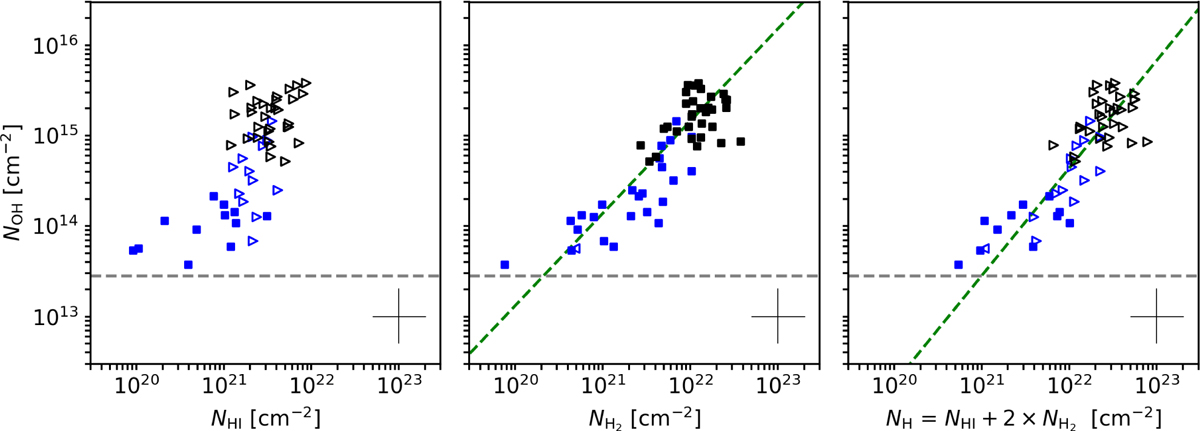
Fig. 3
Download original image
OH column density vs. the column density of H I (left), H2 (middle), and the column density of the total number of hydrogen nuclei (right). Features associated with line-of-sight absorption are shown in blue, features associated with H II regions in black (Rugel et al. 2018). The middle panel shows NOH vs. NH2. Lower limits in case of saturated H I absorption in the left and right plots are indicated by triangles pointing to the right. There is one upper limit due to the non-detection of CO, which is indicated by triangles pointing to the left. Typical error bars are indicated in the lower right corner. The limit of a 3σ detection is indicated by a dashed gray line. The green dashed line indicates the fit of a correlation to the data.
Current usage metrics show cumulative count of Article Views (full-text article views including HTML views, PDF and ePub downloads, according to the available data) and Abstracts Views on Vision4Press platform.
Data correspond to usage on the plateform after 2015. The current usage metrics is available 48-96 hours after online publication and is updated daily on week days.
Initial download of the metrics may take a while.