Open Access
Fig. 5
Download original image
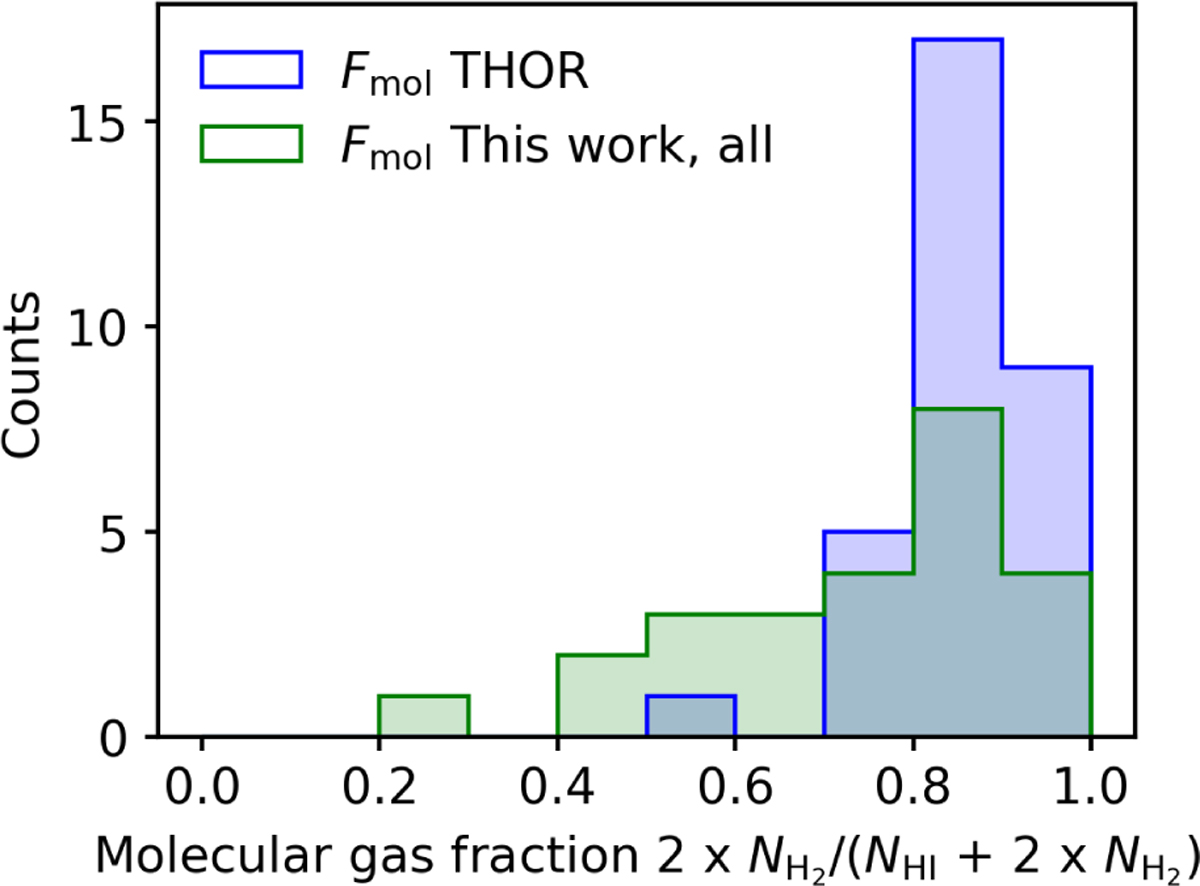
Distribution of the molecular gas fraction in this work (green) in comparison to the sample from THOR (blue). Many of the features included in both samples are upper limits on the molecular gas fraction, as the H I absorption saturates.
Current usage metrics show cumulative count of Article Views (full-text article views including HTML views, PDF and ePub downloads, according to the available data) and Abstracts Views on Vision4Press platform.
Data correspond to usage on the plateform after 2015. The current usage metrics is available 48-96 hours after online publication and is updated daily on week days.
Initial download of the metrics may take a while.