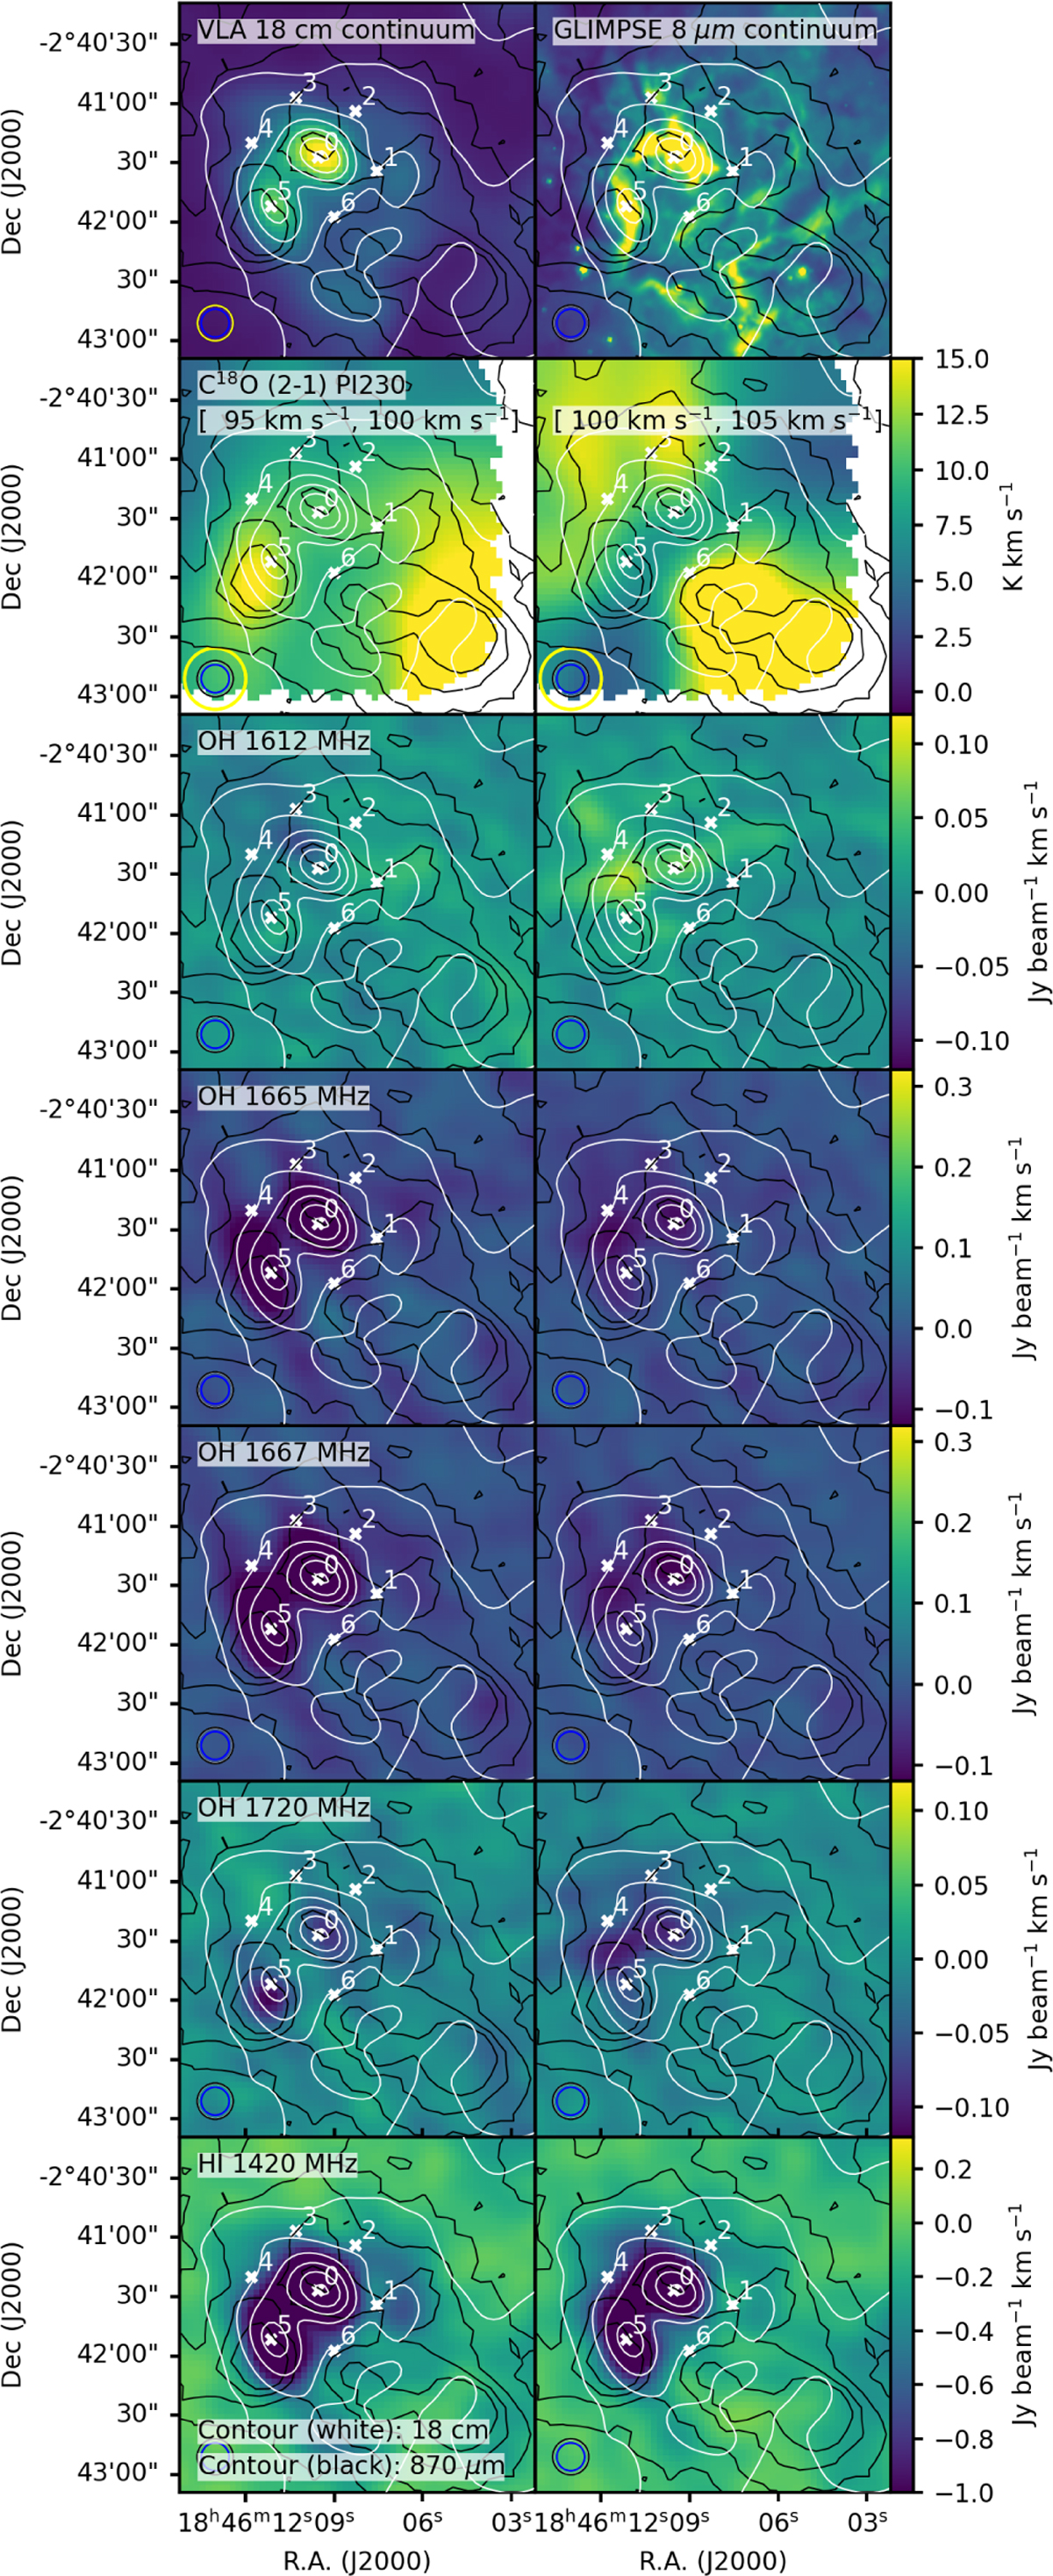
Fig. 7
Download original image
Distribution of VLA 18 cm and GLIMPSE 8 µm continuum emission (top row Benjamin et al. 2003) in G29.935-0.053, with contours of ATLASGAL 870 µm emission (black; at 0.5, 1.0, 1.5 and 2 Jybeam-1 Schuller et al. 2009) and VLA 18 cm continuum (white; in steps of 0.1 Jy beam-1, starting at 0.03 Jy beam-1). The beam of both observations is indicated with a black circle in the lower left. The positions of the upGREAT LFA pixels are indicated, and the beamsize shown in blue. The following rows show spectral lines integrated over 95-100 km s-1 and 100-105 km s-1 in the left and right panels, respectively.
Current usage metrics show cumulative count of Article Views (full-text article views including HTML views, PDF and ePub downloads, according to the available data) and Abstracts Views on Vision4Press platform.
Data correspond to usage on the plateform after 2015. The current usage metrics is available 48-96 hours after online publication and is updated daily on week days.
Initial download of the metrics may take a while.