Fig. 1.
Download original image
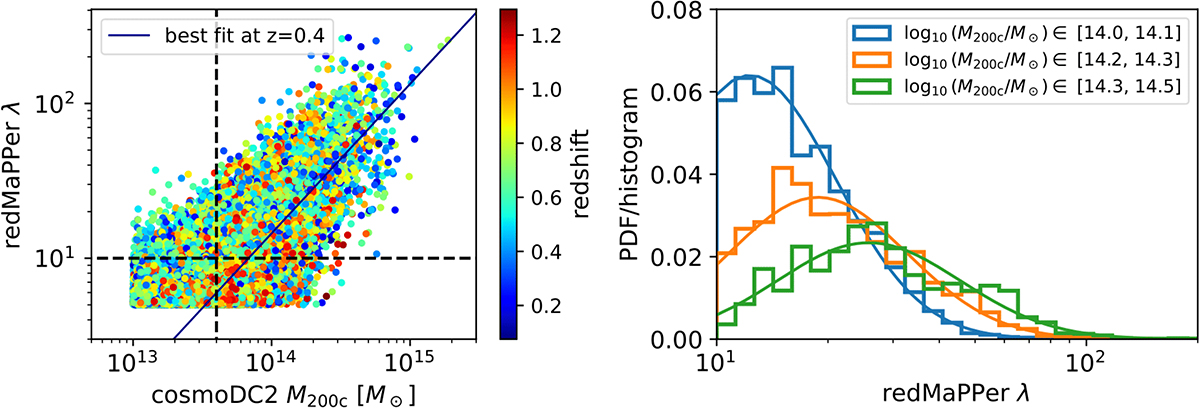
Left: cosmoDC2 halo M200c masses (from the simulation) versus the redMaPPer cluster richnesses. The points are colored with the redMaPPer cluster redshift. The solid line is the best-fitted mean richness-mass relation in Eq. (16) at z = 0.4. The dashed lines represent the low mass and low richness cut used on the cosmoDC2-redMaPPer matched catalog for the fit of the fiducial scaling relation. Right: Histogram of richnesses in bins of mass, and best-fit probability distributions P(lnλ|M, z) from Eq. (15) (solid lines) for the different mass bins.
Current usage metrics show cumulative count of Article Views (full-text article views including HTML views, PDF and ePub downloads, according to the available data) and Abstracts Views on Vision4Press platform.
Data correspond to usage on the plateform after 2015. The current usage metrics is available 48-96 hours after online publication and is updated daily on week days.
Initial download of the metrics may take a while.