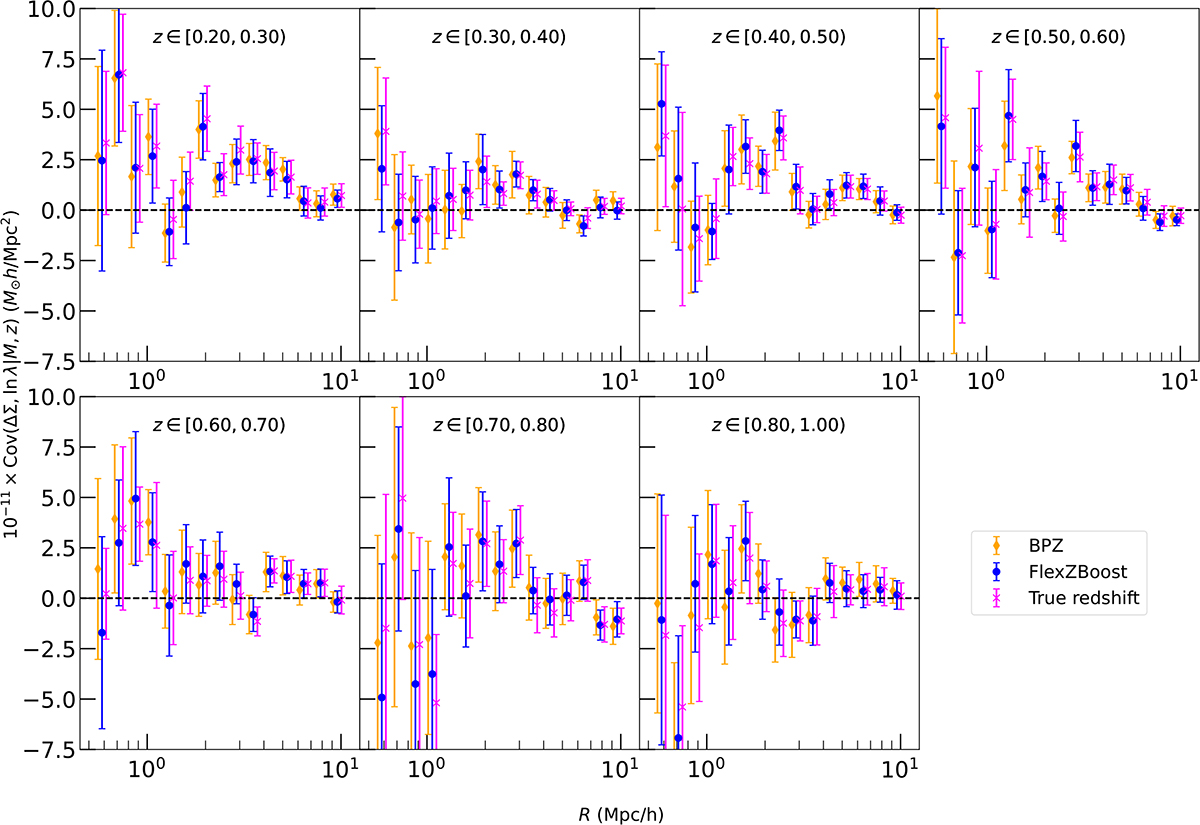
Fig. 10.
Download original image
Binned excess surface density-richness covariance in Eq. (38), as a function of the radius from the cluster center. We stack all clusters between λ ∈ [20, 70) and subdivide by different redshift bins from the top left panel to the bottom right panel. The true redshift case is displayed in pink, the BPZ and FlexZBoost cases are represented in orange and blue, respectively.
Current usage metrics show cumulative count of Article Views (full-text article views including HTML views, PDF and ePub downloads, according to the available data) and Abstracts Views on Vision4Press platform.
Data correspond to usage on the plateform after 2015. The current usage metrics is available 48-96 hours after online publication and is updated daily on week days.
Initial download of the metrics may take a while.