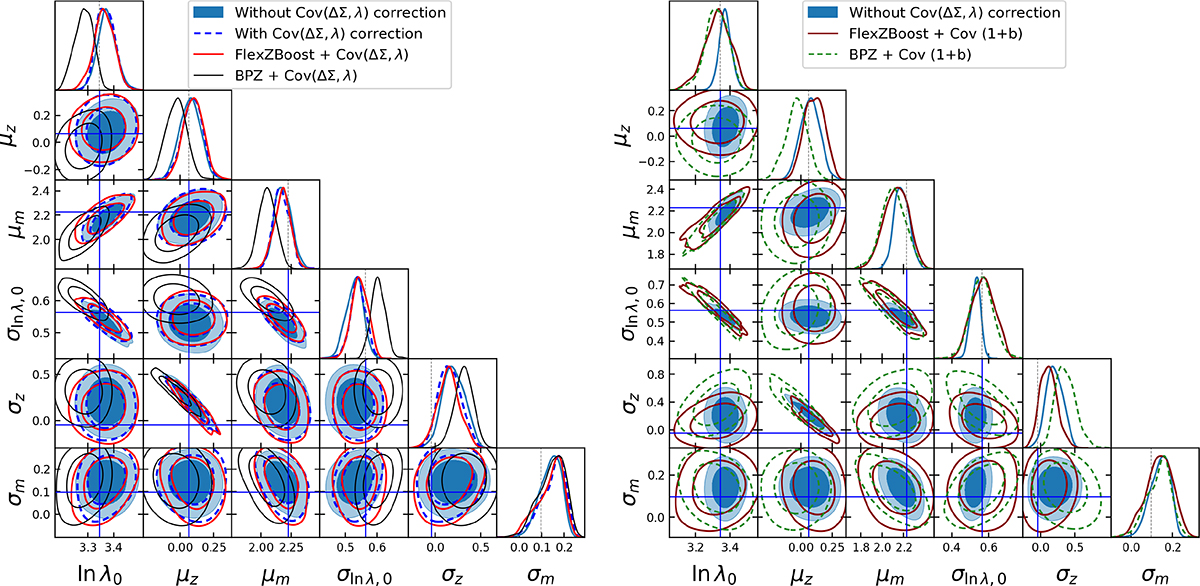
Fig. 12.
Download original image
Impact of shear-richness covariance on scaling relation parameter estimation. Left: Posterior distribution of the scaling relation parameters with (dashed blue) and without (filled blue) the shear-richness covariance correction in Eq. (35), considering true source galaxy redshifts. The red (resp. black) unfilled contours are obtained considering the shear-richness covariance and using FlexZBoost (resp. BPZ) photometric redshifts for source galaxies. Right: The blue filled contours are the same as in the left panel. The purple (resp. dashed green) unfilled contours are obtained considering the shear-richness covariance and using FlexZBoost (resp. BPZ) photometric redshifts, and letting the bias (1 + b) as a free parameter. These two effects explain somewhat the low amplitude (about 1 to 10%) of the shear-richness covariance (let us note that the ln(10)β1/μm factor in Eq. (35) is the order of unity; it does not change our conclusions).
Current usage metrics show cumulative count of Article Views (full-text article views including HTML views, PDF and ePub downloads, according to the available data) and Abstracts Views on Vision4Press platform.
Data correspond to usage on the plateform after 2015. The current usage metrics is available 48-96 hours after online publication and is updated daily on week days.
Initial download of the metrics may take a while.