Fig. 2.
Download original image
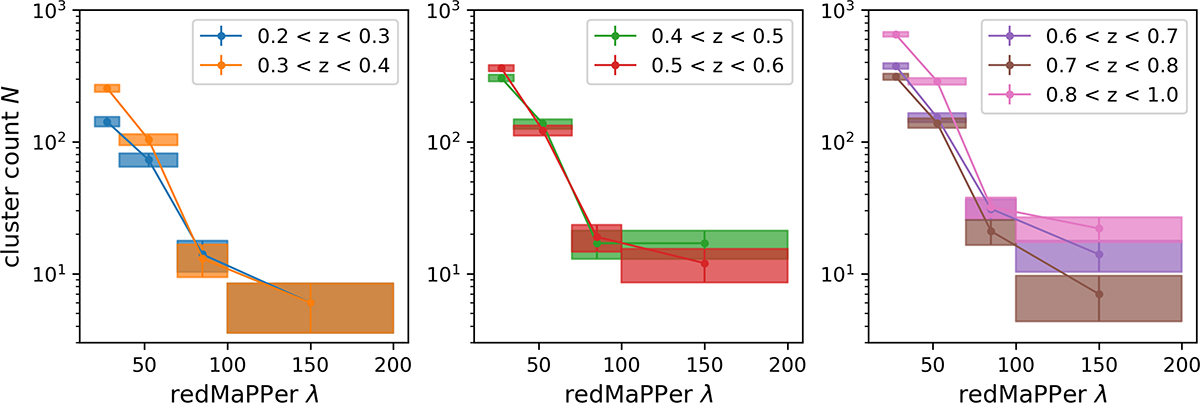
Measured count of redMaPPer cluster as a function of richness, for different richness bins. For each richness-redshift bin, the width of the shaded area represent the width of the richness bin, and the height correspond to the Poisson noise ![]() . The steeper slope of cluster counts at intermediate richness (between the second and third richness bin) for all redshift bins is primarily due to the choice of richness binning, which is not perfectly log-spaced. This steeper inner slope would be mitigated if a log-spaced richness binning were used.
. The steeper slope of cluster counts at intermediate richness (between the second and third richness bin) for all redshift bins is primarily due to the choice of richness binning, which is not perfectly log-spaced. This steeper inner slope would be mitigated if a log-spaced richness binning were used.
Current usage metrics show cumulative count of Article Views (full-text article views including HTML views, PDF and ePub downloads, according to the available data) and Abstracts Views on Vision4Press platform.
Data correspond to usage on the plateform after 2015. The current usage metrics is available 48-96 hours after online publication and is updated daily on week days.
Initial download of the metrics may take a while.