Fig. 3.
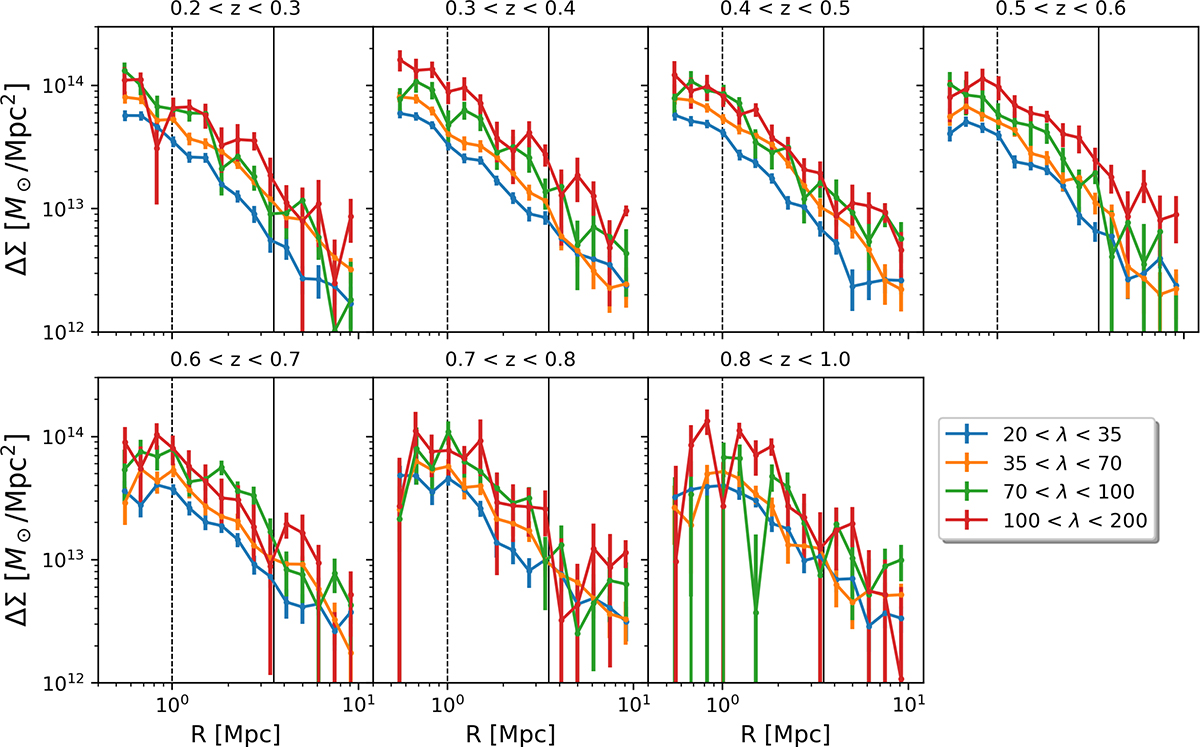
Download original image
Stacked excess surface density profile as a function of the distance to the cluster center, for different richness bins (colors) and different redshift bins (from top left to bottom right). The error bars are the diagonal elements of the bootstrap covariance matrices. The dashed black vertical line (resp. black filled vertical line) represents the R > 1 Mpc cut (resp. R < 3.5 Mpc cut).
Current usage metrics show cumulative count of Article Views (full-text article views including HTML views, PDF and ePub downloads, according to the available data) and Abstracts Views on Vision4Press platform.
Data correspond to usage on the plateform after 2015. The current usage metrics is available 48-96 hours after online publication and is updated daily on week days.
Initial download of the metrics may take a while.