Fig. 8.
Download original image
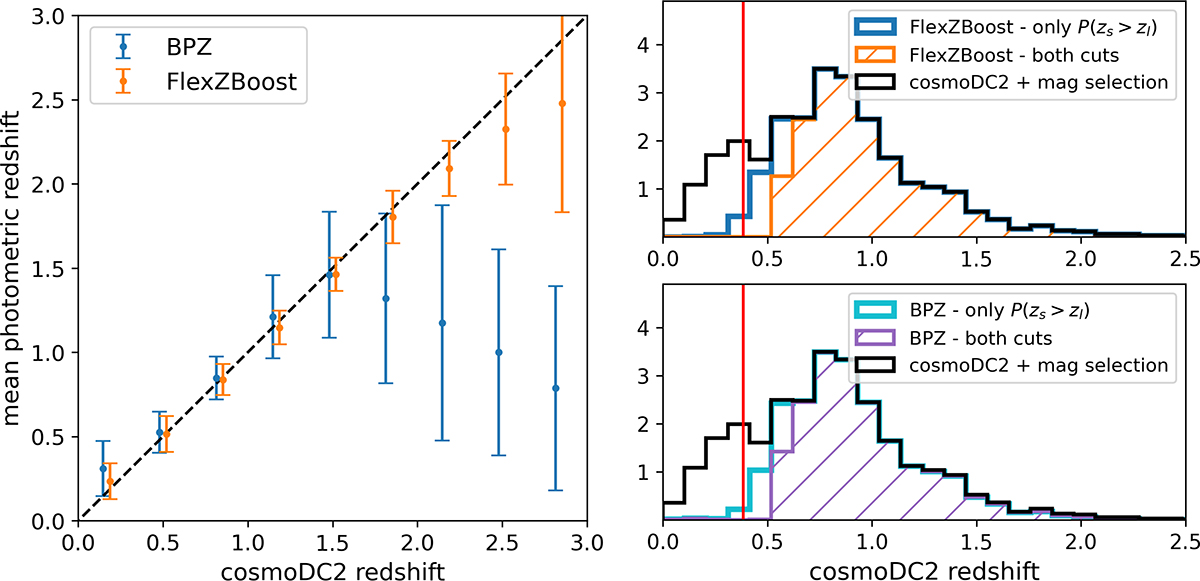
Left: Mean photometric redshift against true cosmoDC2 redshift for BPZ and FlexZBoost methods. Right: Distribution of true cosmoDC2 redshifts after our magnitude cuts (black). Upper panel: The blue distribution represents the same distribution after a cut on the probability P(zs > zl) using FlexZBoost photometric redshift, for a cluster at z = 0.38. The orange distribution is obtained after combining the P(zs > zl) cut and the mean redshift cut. Lower panel: Same as upper panel but for BPZ redshifts. On both panels, the vertical red line indicates the position of the cluster redshift.
Current usage metrics show cumulative count of Article Views (full-text article views including HTML views, PDF and ePub downloads, according to the available data) and Abstracts Views on Vision4Press platform.
Data correspond to usage on the plateform after 2015. The current usage metrics is available 48-96 hours after online publication and is updated daily on week days.
Initial download of the metrics may take a while.