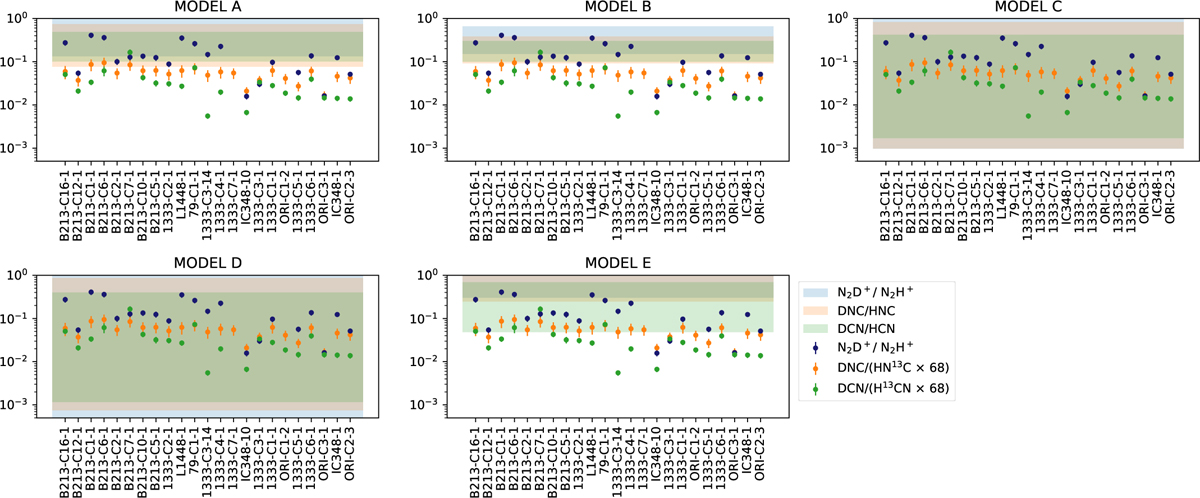
Fig. B.6
Download original image
Comparison between observations and chemical model predictions for chemical ages between 0.1 and 10 Myr. Blue, orange, and green dots represent the different observed deuterium fraction ratios across the core sample. The shadowed areas show the predicted range of values of the ratios from 0.1 Myr to 10 Myr. The sources are ordered by increasing kinetic temperature.
Current usage metrics show cumulative count of Article Views (full-text article views including HTML views, PDF and ePub downloads, according to the available data) and Abstracts Views on Vision4Press platform.
Data correspond to usage on the plateform after 2015. The current usage metrics is available 48-96 hours after online publication and is updated daily on week days.
Initial download of the metrics may take a while.