| Issue |
A&A
Volume 700, August 2025
|
|
|---|---|---|
| Article Number | A226 | |
| Number of page(s) | 22 | |
| Section | Interstellar and circumstellar matter | |
| DOI | https://doi.org/10.1051/0004-6361/202554121 | |
| Published online | 19 August 2025 | |
Gas phase Elemental abundances in Molecular cloudS (GEMS)
XI. The evolution of HCN, HNC, and N2H+ isotopic ratios in starless cores
1
Centro de Astrobiología (CSIC-INTA),
Ctra. de Ajalvir, km 4, Torrejón de Ardoz,
28850
Madrid,
Spain
2
Observatorio Astronómico Nacional (OAN),
Alfonso XII, 3,
28014
Madrid,
Spain
3
Exoplanets and Planetary Formation Group, School of Earth and Planetary Sciences, National Institute of Science Education and Research,
Jatni
752050,
Odisha,
India
4
Homi Bhabha National Institute,
Training School Complex, Anushaktinagar,
Mumbai
400094,
India
★ Corresponding authors: This email address is being protected from spambots. You need JavaScript enabled to view it.
; This email address is being protected from spambots. You need JavaScript enabled to view it.
Received:
13
February
2025
Accepted:
3
July
2025
Abstract
Context. Isotopic ratios have been used as chemical diagnostics to investigate the origin of the material in the Solar System. These isotopic ratios depend on the physical conditions at formation but can be altered during the star formation process through different physical and chemical processes.
Aims. Our aim is to determine the HCN, HNC, and N2H+ isotopic ratios and the chemical age in a large sample of starless cores located in different environments.
Methods. This work uses IRAM 30 m data to constrain the D/H isotopic ratios of HCN, HNC, and N2H+ as well as the 14N/15N ratio of HCN and HNC. We also modeled the deuterium fractions with the chemical code DNAUTILUS 2.0.
Results. Deuterated compounds are detected in all of our sample cores, with average DNC/HNC, DCN/HCN, and N2D+/N2H+ values of 0.054±0.019, 0.036±0.033, and 0.15±0.11, respectively. The deuterium fractions (Dfrac) show a weak correlation with temperature and a large scatter that reflects that other factors such as core evolution could also play a significant role. Our chemical model is able to reproduce all the observed values with 0.2–0.3 Myr in Taurus and 0.3–0.5 Myr in Perseus and Orion. The 14N/15N isotopic ratio is found to be different between HCN∕HC15N (430±120) and HNC∕H15NC (296±64). We find no correlation between these ratios and the deuterium fractions, but we report a weak correlation with temperature was found.
Conclusions. The deuterium fractions of HCN, HNC, and N2H+ can be used as evolutionary tracers of starless cores as long as the physical parameters are well constrained. The HCN/HC15N and HNC/H15NC ratios are not correlated with Dfrac, suggesting that the detected variations are not correlated with the core evolutionary stage. The average value of the HCN/HC15 N ratio in our sample is significantly higher than the values measured in protostars and protoplanetary disks, possibly indicating that nitrogen fractionation processes are taking place during the protostellar phase.
Key words: astrochemistry / stars: formation / stars: low-mass / ISM: abundances / ISM: clouds / ISM: molecules
© The Authors 2025
 Open Access article, published by EDP Sciences, under the terms of the Creative Commons Attribution License (https://creativecommons.org/licenses/by/4.0), which permits unrestricted use, distribution, and reproduction in any medium, provided the original work is properly cited.
This article is published in open access under the Subscribe to Open model. This email address is being protected from spambots. You need JavaScript enabled to view it. to support open access publication.
1 Introduction
Isotopic ratios provide invaluable insights into the connection between Solar System objects and the Galactic interstellar medium (Aléon 2010). One example of the great astrobiologi-cal interest in isotopic ratios concerns the elevated HDO/H2O ratio measured in the terrestrial oceans (Vienna Standard Mean Ocean Water = 1.5 × 10⁻⁴; Lécuyer et al. 1998), which is one order of magnitude larger than the cosmic value (D/H = 1.6 × 10⁻⁵, Linsky 2007). This discrepancy has been interpreted as being clear evidence that at least part of Earth’s water was delivered by comets from the outer Solar System, bearing a chemical composition akin to interstellar grains in starless cores. The 14 N/15 N ratio has also been proposed as a tracer of the evolution of material from molecular clouds to planetary systems. Different 14N∕15N values have been found in the Solar System: ~440 (Owen et al. 2001; Fouchet et al. 2004) in the solar wind and Jupiter (also considered as a representative ratio of the protosolar nebula), ~270 on Earth (Aléon 2010), and ~136 in comets (Shinnaka et al. 2016). From this, we may infer that there was an enrichment of 15N during the formation of the Solar System (Füri & Marty 2015). Despite the increasing number of observations, the origin of this enrichment is still unknown, having found a wide range of 14N/15N ratios through different molecules: 190–783 for HNC, HCN, CN, or 180–1300 for N2H+ in high-mass star-forming cores at different galactocentric distances (Colzi et al. 2018b; Fontani et al. 2015). Understanding the chemical processes that alter these ratios is a requisite to disentangling the intricate physical and chemical processes occurring during the formation of a low-mass star and to eventually determining the origin of these molecules in the Solar System.
Deuterium fractionation is widely used as a chemical diagnostic to establish the evolutionary stage of starless cores, i.e., dense (>104 cm−3) and cold (~10 K) regions of molecular gas without compact luminous sources, where stars may eventually be formed (Crapsi et al. 2007; Navarro-Almaida et al. 2023; Esplugues et al. 2022; Rodríguez-Baras et al. 2023). At these temperatures, deuterium fractionation is primarily driven by the reaction of H3+ with HD to form H2D+ and H2 (Millar et al. 1989). The formation of H2D+ proceeds without a reaction barrier, whereas the backward reaction has an endothermicity of ∼232 K when H2 is in para J = 0 level, and therefore it does not proceed at these cold temperatures, as far as para-H2 is concerned (Watson 1974; Caselli & Ceccarelli 2012; Albertsson et al. 2013). The backward reaction can occur, and deuterium fractionation does not proceed if the ortho-H2 makes a significant contribution (Pagani et al. 2009), but the ortho-to-para ratio is less than 0.01 in cold molecular clouds (Dislaire et al. 2012). Therefore, at these low temperatures there is an enhancement of H2D+ abundance and the H2D+∕H+3 ratio becomes larger than the D/H elemental abundance ratio (Pagani et al. 1992). Successive reactions of H2D+ with HD form D2H+ and D+, and all of these ions transfer deuterium to other molecules in the gas phase. The enhanced atomic D/H ratio in the gas phase is also transferred to grains, promoting the deuteration of the molecules formed on their surfaces such as CH3 OH, H2O, and H2S (Ambrose et al. 2021; Rodríguez-Baras et al. 2023). Although H+3 is the main ion driving deuteration at low temperatures, HD may also react with CH+ and C2H+2 since it is the main pathway for deuteration at high temperatures. The endothermicity of the reverse reactions is much larger (Parise et al. 2009), which leads to large enhancements of deuterated ions (e.g., CH2D+, C2HD+, Millar 2005; Roueff et al. 2007, 2015), and this could also transfer deuterium to other compounds. Another important factor in deuterium fractionation is given by CO depletion. CO plays a significant role in regulating the H+3 abundance through destruction reactions. In cold dense regions, CO freezes onto dust grains, leading to an increase in the H+3 abundance and enhancing deuterium fractionation (Dalgarno & Lepp 1984; Caselli et al. 2002; Roberts et al. 2003).
The efficiency of the deuterium enrichment under these conditions is now well established with the detection of single and multiply deuterated molecules in starless cores and young protostars (Roueff et al. 2000; Parise et al. 2002; Bacmann et al. 2003; Melosso et al. 2020). Although there seems to be a general trend with deuteration increasing at low temperatures for all species in cold regions, different species probe different regions along the line of sight and probe different layers of the molecular cloud. In particular, N-bearing species such as NH3, N2H+, and nitriles (HCN, HNC, CN) are still abundant in regions where most molecules are highly depleted (Tafalla et al. 2006; Sipilä & Caselli 2018; Kim et al. 2020). The observation of N-bearing species and their deuterated compounds are therefore expected to provide essential information on the physical conditions and the evolutionary stage of starless cores.
The dominant mechanism for the nitrogen fractionation in the interstellar medium is not clear. Similar to D-enrichment, isotopic exchange reactions at low temperatures can produce 15N-enrichment (Rodgers & Charnley 2008). However, this mechanism has been challenged in the case of N2H+ because of the barriers between the interacting molecules found in theoretical works (Roueff et al. 2015). This is not consistent with observational results toward starless cores, and later studies have proposed that the isotope-selective photodissociation might be the key (Spezzano et al. 2022a). In this case, 14N2 self-shielding is more effective against photodissociation than that of 14N15N, leading to a higher availability of free 15N to form 15N-bearing molecules. Comparison between chemical models and observations of nitriles (CN, HCN, HNC) is difficult because carbon and nitrogen chemistry are interdependent. Observed 14N/15N isotopic ratios are usually based on the observation of the 13C isotopologs to avoid opacity problems. This implies assuming a fixed 12C/13C ratio, with 12C/13C = 68 being the canonical value (Milam et al. 2005). However, this value is not held for all molecular compounds because isotopic fractionation reactions change it (Roueff et al. 2015). For example, the ratio of HCCCN/H13CCCN is 79 (Takano et al. 1998), CCS/13CCS is 230 (Sakai et al. 2007), and CCH/13CCH is greater than 250 (Sakai et al. 2010). The isotopic 12C/13C and 14N/15N ratios both need to be known to be able to interpret observations.
In this paper, we use data from the IRAM 30 m large program Gas phase Elemental abundances in Molecular CloudS (GEMS; PI Asunción Fuente, Fuente et al. 2019) observations to investigate the deuterium fraction of HCN, HNC, and N2H+ as well as the 12C/13C and 14N/15N isotopic ratios in a wide sample of starless cores. In particular, we selected 23 low-mass cores out of the GEMS sample located in three different molecular clouds: Taurus, Perseus, and Orion. Additional observations were taken with the IRAM 30 m telescope to complete the dataset in these sources. We did not consider in our study TMC 1- CP, TMC1-C, and NGC 1333-C7-1, which are also included in GEMS, because these objects were previously studied by Navarro-Almaida et al. (2021) and Navarro-Almaida et al. (2023). The paper is organized as follows: The full observational dataset is described in Sect. 2. In Sect. 3 the sample is briefly described, while in Sect. 4 we describe the density of H2 and molecular column densities derivation. Sect. 5 provides our isotopic ratio results. We discuss the relationship between the observed isotopic ratios and the evolutionary stage and the cores of our sample as well as their chemical and physical histories in Sect. 6. Finally, we summarize our conclusions in Sect. 8.
2 Observations
This work is based on two IRAM 30 m observational projects1: GEMS2 (No. 006-17) and the project 011-20. The first one is an IRAM 30 m Large Program run between summer 2017 and 2019. A detailed description of these observations is given by Fuente et al. (2019). Intense lines of more than 12 species lied in the GEMS setup. Among them, the ground-state J = 1→0 lines of HCN, H13CN, HC15N, HNC, H15NC and N2H+ that we are using. Observations of the project No. 011-20 were carried out in 2020 with the IRAM 30 m telescope. These observations targeted the HN13C J = 1→0, DN13C J = 1→0, DNC J = 1→0 and J = 2→1, DCN J = 1→0, N2H+ J = 1→0, and N2D+ J = 2→1 lines. Table A.1 shows the observed transitions and their spectroscopic information that were taken from the CDMS catalog (Müller et al. 2001, 2005; Endres et al. 2016) except for H15NC and HN13 C 1-0 lines (obtained from the JPL catalog, Pickett et al. 1998) and DN13C 1-0 (from SLAIM, Remijan et al. 2007).
For both projects, the Eight MIxer Receivers (EMIR) and the Fourier Transform Spectrometer (49 kHz resolution) were deployed using frequency-switching observing mode for 2 and 3 mm observations. Main-beam temperature scale TMB is the intensity scale, related with TA by TMB = (Feff/Beff) TA*. The telescope forward and main beam efficiencies Feff, Beff, as well as the beam width at the frequencies of interest are also included in Table A.1. They were obtained by interpolating the efficiencies and the beam widths measured by EMIR in 20093 since they vary as θMB(″) = (2460/ν(GHz)).
Data reduction was carried out using the CLASS package from IRAM GILDAS software4. We used the Ruze equation which is included in this package, so as to get the conversion between the before-mentioned temperatures.
Source sample: Low-mass cores studied in GEMS and 011-20 projects.
3 Source sample
We studied 23 low-mass starless cores. These cores are located in three archetypal molecular clouds with different star formation activity: Taurus, Perseus, and Orion. In the following, we briefly discuss our sample (listed in Table 1).
The Taurus molecular cloud (TMC) is one of the closest molecular clouds (~141 pc, Zucker et al. 2019) and is a wellthought-out archetypal low-mass star-forming region (~104 M⊙, Goldsmith et al. 2008), whose structure and evolution have been analyzed in several studies (Palmeirim et al. 2013, Hacar et al. 2013). In this work, we have studied B 213, a dense prominent filament that could be accreting material along striations from its surroundings (Palmeirim et al. 2013). B 213 ends up in the L1495 cloud, which contains several Barnard dark nebulae. In particular, we considered eight starless cores (see Table 1; numeration by Hacar et al. 2013).
Perseus is a low- and intermediate-mass star-forming molecular cloud (~400 young stellar objects), at a distance of ~294 pc (Zucker et al. 2019). Unlike Taurus, many of its protostars are associated in protoclusters. Cores located in NGC 1333 and IC 348 regions are immersed in a more active environment due to their proximity to these clusters, while the studied core in Barnard 5 may be affected by an energetic outflow (Langer et al. 1996). On the contrary, L1448 (in the western Perseus) is a more quiescent region.
Orion A is the most active nearby complex, located at ~432 pc (Zucker et al. 2019). We studied three low-mass starless cores in three different clouds: ORI-C3 (OMC-2), ORI-C1 (OMC-3), and ORI-C2 (OMC-4), the first one being the closest to the HII region and the last one the least luminous and turbulent of the region.
4 Density and molecular column density estimates
In this section, we carry out a multi-transitional study of the lines we observed (Table A.1) to obtain the H2 gas density and the column density of the molecular species listed in Table A.1. We first fitted the observed lines using the minimize routine of the CLASS-GILDAS software. The line profiles of transitions with unresolved hyperfine structures are shown in Fig. B.8, and their properties (radial velocity, linewidth, intensity and flux) are listed in Table A.2. In the case of molecules with resolved hyperfine structure, we used the HFS method of GILDAS-CLASS in order to obtain line opacities (see Table A.3).
4.1 DNC
We observed two rotational lines of DNC (J = 1→0 and 2→1), which allowed us to run RADEX for different pairs of values of n(H2) and N(DNC) for each starless core. In our calculations, we assumed that Tk = Tdust and that the emission fills the beam (beam filling factor = 1): typical angular sizes of pre-stellar cores are ~10 000 AU (Ceccarelli et al. 2014), corresponding to 73″ for cores in Taurus (d = 141 pc, Zucker et al. 2019), 35″ in the case of Perseus (d = 294 pc) and 24″ in Orion (d = 432 pc), whereas the beam widths for our transitions are 15″-32″ (see Table A.1). Dust temperatures were taken from the calculations by Palmeirim et al. (2013), Lombardi et al. (2014), and Zari et al. (2016) on the basis of the Herschel Gould Belt Survey (André et al. 2010) and Planck data (Bernard et al. 2010). Following this method, the program was run with column density values ranging from 5 × 10¹¹ to 1015 cm−2 and H2 densities from 5 × 10³ to 106 cm−3 (typical values for starless cores). The results are shown in Table 1.
In Fig. 1 we compare the obtained densities with those derived with CS in Rodríguez-Baras et al. (2021). In that case, densities were obtained from two transitions (J = 2→1 and 3→2) of CS, C34S, and 13CS using a Monte Carlo Markov chain methodology with a Bayesian inference approach. Considering the uncertainties, 8 out of 23 starless cores present compatible results. For the rest of sources, the densities obtained with DNC are greater than those with CS, up to a factor of 11 higher in 79-C1-1 and 1333-C3-14. This is consistent with the interpretation of the DNC emission coming from the densest and coldest part of the starless cores in which CS is severely depleted. In this scenario, one would expect that the greatest difference between the densities calculated from DNC and CS data would be found in the more evolved starless cores. However, we do not find any correlation between the difference between the densities calculated from DNC and CS, and the absolute value of the density estimated by using DNC. This lack of correlation could be due to the still significant uncertainties in our density estimates (up to 30– 50%, see Table 1). Moreover, the angular resolution is limited and the beam is larger than the densest region of the core; therefore, the derived densities might not represent the peak densities. Although a detailed discussion is presented later, we note that some of the cores with the highest nH2 (DNC)/nH2 (CS) appear to be among the most evolved ones based on trends that are explored with chemical models and deuterium fraction (Sect. 6).
Finally, we would like to remind that we assumed that the gas temperature is fixed and equal to the dust temperature. The densities derived using the DNC lines are sensitive to temperature. With the aim to estimate the uncertainty introduced by the fixed temperature values, we calculated the molecular hydrogen densities toward all starless cores again, introducing a kinetic temperature of 7 K. The cores located in Taurus (the coldest of those we have considered) would increase their density by a factor of 2. This factor increases for cores with higher temperatures, such as those in Orion (see in Table 1), for which the density would be about one order of magnitude higher. More accurate density calculations, and based on higher spatial resolution observations are required to have a more accurate view of the starless core structure.
 |
Fig. 1 Comparison between molecular hydrogen densities calculated from DNC in this work and from CS in Rodríguez-Baras et al. 2021. The dashed horizontal line indicates the separation between the more and less evolved cores (see Sect. 6). |
References for the collisional rate coefficients.
4.2 HNC, HN13C, DN13C, H15NC and HC15N
In order to calculate the intended column densities of the other molecules with unresolved hyperfine structure components (HNC, HN13C, DN13C, H15NC, and HC15N), we used RADEX with the densities obtained with DNC and the collisional coefficients without hyperfine structure listed in Table 2.
The uncertainties in the column density estimates shown in Table A.5 are defined as the maximum between the error in the integrated intensity and the calibration error, which is assumed to be as 10%. Apart from calibration, one of the main sources of uncertainty to consider is the low angular resolution of the telescope (between ~ 14″ and ~29″ depending on frequency), which implies that the emission from the inner regions is blended with the outer cold areas. This mainly affects Orion and Perseus cores at low frequencies. Also, the possible volume density gradients along the line of sight may influence the results as well.
The obtained column densities are included in Table A.5 and the observed line profiles are shown in Fig. B.8. The HN13C column density N(HN13C) ranges from 3.59 × 10¹¹ (in B213-C5) to 2.14 × 1012 cm−2 (in 1333-C4). In these starless cores, we also detected the lowest and highest H15NC column densities, 5.75 × 10¹⁰ and 1.53 × 10¹², respectively. This pattern is also obtained for DN13C and HC15N, with non-detection in the first core and the highest molecular column densities in the second one, suggesting that these two cores are in an early and late phase, respectively.
4.3 HCN, H13CN, DCN, N2H+, and N2D+
We used the collisional coefficients listed in Table 2 and the densities obtained with DNC (Table 1) to derive the column densities of the molecules with resolved hyperfine structure. In the case of H13CN, DCN and N2H+, the collisional coefficient files take into account the hyperfine structure. For these species, we ran RADEX over a range of column density values from 1011 to 1014 cm−2. For each value, we compared the observed fluxes of each hyperfine component with the corresponding synthetic ones by evaluating ε2:
 (1)
(1)
The optimal column density was determined as the value that minimized that ε2.
In the case of HCN, this method failed to reproduce observations accurately, due to its lines being optically thick: trying to fit the main component led to a significant underestimation of the column densities. Instead, we follow a different method: we first estimated a partial column density by fitting the integrated intensity of the weakest hyperfine component with RADEX. The total column density of the species was then obtained scaling the partial column density by the spectroscopic integrated intensity ratio between the total splitting and the weakest hyperfine component. However, the weakest hyperfine line of HCN 1-0 is optically thick in almost all the targets (see opacities in Table A.3), which still leads to an underestimation of HCN column densities; thus we consider its 13C isotopolog from now on.
Regarding N2D+, given that its transitions were optically thin in all targets (see Table A.3) and that we did not spectrally resolve the hyperfine components, we did not consider hyperfine splitting in the RADEX calculations. We ran RADEX until the resulting integrated intensity was compatible with the sum of fluxes of all components obtained in the Gaussian fits.
The results of the column densities that were eventually used for our subsequent discussion are shown in Table A.6. Once again, B213-C5 presents one of the lowest column densities: N(H13CN) = (3.16 ± 0.44) × 1011, N(DCN) = (6.87 ± 0.69) × 1011, and N(N2H+) = (3.80 ± 0.38) × 1012. The core 1333-C4 exhibits the highest ones: N(H13CN) = (4.94 ± 0.49) × 1012 and N(N2D+) = (4.16 ± 0.42) ×1012.
5 Isotopic and isomeric ratios
5.1 12C/13C
Before going deeper into our discussion of the deuterium fractionation and the 14N/15N isotopic ratio, we relay the information regarding our investigation of the 12C/13C and isomeric ratios. Rare isotopologs are often used as representative of the most abundant ones because of their generally optically thin transitions. Nevertheless, isotopic ratios are usually uncertain since they depend on a great variety of factors. For instance, the results of Roueff et al. (2015) suggest that the H12CN/H13CN and HN12C/HN13C ratios can be up to twice higher than the solar isotopic ratio depending on the chemical age.
We obtained 12C/13C for HCN, HNC, and DNC (see Table A.7). The resulting average of the HCN/H13CN ratio, ~33, is lower than the ISM value 12C/13C = 68 ± 15 (Milam et al. 2005). However, our results are not reliable because of the high opacities (listed in Table A.3). This low average value could be explained by the underestimation of N(HCN) due to the high optical thickness of the HCN 1-0 line. ORI-C3-1, a target where HCN 1-0 was found to be optically thin, is the exception, as HCN/H13CN = 144 ± 20. The opacity problem is even more remarkable for the HNC 1-0 line, and thus the low observed value of the HNC/HN13C ratio, with an average of ~10. DN12C/DN13C is not expected to be as affected by opacity, and therefore it is more adequate for a comparison with the standard value of 68 ± 15 in Fig. 2. Our results seem to be consistent with that value for almost all starless cores (11 out of 14 where DN13C was detected). Additionally, the obtained 12C/13C ratios in ORI-C1-2 and ORI-C2-3 are compatible with the results found in Orion (in the coldest regions of Orion KL) by Esplugues et al. (2013). Some cores lie out of the 68 ± 15 shadowed area in Fig. 2, but never more than a factor of 2, as predicted by Roueff et al. (2015).
In the following study, we adopted the canonical value of 68 (Milam et al. 2005) as the 12C/13C ratio in our sample.
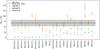 |
Fig. 2 Comparison between our 12C/13C ratio results (represented with dots; open dots are for the lower limits) and the ISM canonical value of 68 ± 15 (Milam et al. 2005) (shown with a horizontal band). |
5.2 Isomeric ratios: HCN/HNC, H13CN/HN13C, HC15N/H15NC, and DCN/DNC
The HCN/HNC ratio has been interpreted as a gas kinetic temperature tracer (Hacar et al. 2020). In starless cores, under cold and dense conditions, HCN/HNC is expected to be −1 (Daniel et al. 2013), increasing at higher temperatures. As a result of underestimations again (even greater for N(HNC)), HCN/HNC was found to be greater than 1. We consider that the isomeric ratios of the isotopologs are more reliable. In general, our results (listed in Table A.7) are close to 1, being H13CN/HN13C = 1.24 ± 0.44 and HC15N/H15NC = 0.89 ± 0.30. We checked any possible correlation with the gas temperature by using a linear regression fit. The slope and correlation coefficient obtained for the H13CN/HN13C ratio demonstrate the lack of correlation between these isomeric ratios and gas temperatures in starless cores (shown in Fig. B.1). A weak correlation is observed for HC15N/H15NC, with strong statistical significance (p-value=0.017). We might think that these results are due to analyzing different star-forming regions. However, after doing linear fits to individual regions, the resulting R2 remained low, with high p-values, suggesting a random distribution. Even so, this is still consistent with results reported by Hacar et al. (2020) since the temperature range in our sample (10–22 K) is too small to confirm or reject this trend.
5.3 Deuterium fractionation
The deuterium fractionation is defined as the abundance ratio between a deuterated molecule and its hydrogen-bearing counterpart. Significant deuterium fraction enhancements can be detected in some sources. In particular, for starless cores (under cold and dense conditions), the more evolved they are, the higher Dfrac is expected until the protostar forms. After this collapse, the young stellar object starts to heat the gas and dust in the surroundings, leading to a Dfrac drop. Thus, deuterium fraction can be used to trace the evolutionary stage.
The value of Dfrac for HNC, HN13C, HCN, and N2H+ was obtained from the column densities shown in Tables A.5 and A.6. We calculated DNC/HNC and DCN/HCN in two different ways: a direct method through the use of their column densities, and an indirect one, using the H13CN and HN13C isotopologs and assuming the canonical 12C/13C isotopic ratio (Milam et al. 2005). The first method can lead to an overestimation of Dfrac due to the higher opacity of the main isotopolog line. The second method solves this problem since we expect the emission of H13CN and HN13C to be optically thin, although we should also consider its downsides: the HCN/H13CN and HNC/HN13C could differ from the ISM value as much as a factor of 2 due to isotopic fractionation reactions (see Roueff et al. 2015). When DN13C is detected, the DN13C/HN13 C value presents higher accuracy. Since we have obtained DNC/DN13C ratio consistent with the canonical value, we considered that the indirect method can provide better estimates of Dfrac than the direct one. The values of Dfrac obtained for the studied molecules are shown in Table A.8 and Fig. 3.
The compound DN13C is the only deuterated molecule that was not detected in all starless cores, with a rate of successful detections of 60.9%. Most of the non-detections occur in starless cores that are immersed in the most active environments: B213-C5, which is in a northern region containing the largest number of evolved objects in B213; the two cores that were considered in IC 348 (C1-1, C1-10) as well as three cores located in NGC 1333 (C1-1, C3-1, C6-1), which are regions associated with protostar clusters in Perseus; and ORI-C3-1, nearby an HII region. On the opposite side, the DN13C line was detected in almost all the cores of Taurus. In Perseus, the highest column densities of D-bearing molecules are always found in 1333-C4, usually followed by 1333-C3-14. In fact, 1333-C3-14 has been proposed as a Class 0 object, and our 1333-C4 results might be contaminated by a protostar candidate (Foster et al. 2015) located at a distance of 12.57″, which is lower than the beam size. Regarding Orion A, ORI-C1-2 is the only starless core where DN13C was detected, and it has the highest Dfrac ratios, due it being the core with the highest extinction (Aν = 173.0 mag) and the lowest temperature (Tk = 18.1 K), so that deuteration can be enhanced because of CO depletion. The trend observed for Dfrac (HNC) is similar to those found for the rest of species we considered. In general terms, the starless cores that present the highest (indicated by green arrows in Fig. 3) and lowest values of Dfrac (indicated by dark yellow arrows in Fig. 3) are the same for HCN, HNC, and N2H+, with some variations that are discussed in details in the following.
The deuterium fraction of HNC turned out to be slightly higher than that of HCN: average values of 0.085 ± 0.034 and 0.054 ± 0.019 for DN13C/HN13C and DNC/(HN13C × 68), respectively, compared to 0.036 ± 0.033 for DCN/(H13CN × 68). Comparing our results with those obtained by other authors, Turner (2001) reported slightly lower vales of DNC/HNC and DCN/HCN (0.018 and 0.008, respectively) in the prototypical starless core TMC 1, again with Dfrac (HNC) > Dfrac (HCN). Navarro-Almaida et al. (2023) obtained Dfrac (HNC) = 0.094 ± 0.033 and Dfrac(HCN) = 0.075 ± 0.027 toward TMC 1-C and Dfrac (HNC) = 0.095 ± 0.034 and Dfrac(HCN) = 0.032 ±0.011 toward 1333-C7-1. Similar results are obtained in protostars: DNC/HNC ~ 0.08 and DCN/HCN ~ 0.07 in HH211 (Giers et al. 2023) or DNC/HNC - 0.11 and DCN/HCN - 0.03 in B1-b (Daniel et al. 2013). Although the difference between the deuterium fraction of the two isomers is of about a factor of −2, roughly within the uncertainties, this result seems to be systematic and can reflect a change in the HCN/HNC ratio along the line of sight, or in the efficiency of the deuteration mechanisms.
The highest values of Dfrac were measured for N2H+, which presents the highest mean value (0.15), but also the highest dispersion (0.11). Moreover, this scattering of Dfrac (N2H+) values is not related with the different molecular cloud complexes, but stands within each considered region. In particular, the average N2D+/N2H+ is 0.20, 0.14 and 0.03 with a standard deviation of 0.12, 0.10, and 0.018 in Taurus, Perseus, and Orion, respectively. Similar values of Dfrac (N2H+) were obtained by Crapsi et al. (2005): average value of 0.11 ± 0.10 from a different sample of 29 starless cores. Although this ratio is expected to decrease after the collapse, comparable values were observed for 20 protostars by Emprechtinger et al. (2009), with an average ratio of 0.10 ± 0.07. Nevertheless, the molecular lines considered mainly trace the cold envelope, whose physical and chemical composition remains similar to the pre-stellar phase.
In Fig. B.2, we explore the correlation of the observed values of deuterium fractionation with the average temperature along the line of sight. Comparing the values of Dfrac (HNC), Dfrac (HCN),andDfrac (N2H+), we concluded that Dfrac (HNC) and Dfrac (HCN) exhibit a higher correlation with temperature than Dfrac (N2H+), with a strong statistical significance (p-value ≤ 0.03). The adopted temperature was derived from Herschel observations and represent an averaged value along the line of sight, and it is expected to be higher than the value in the densest part of the core. We can reasonably assume that DNC and DCN are tracing a more external part of the core than N2D+ with an averaged temperature closer to that obtained from Herschel observations. Previous observational works suggest that the abundance of the deuterated compound N2D+ is more affected by the density and the chemical time, both related with the evolutionary stage of the starless core. Using a chemical model, Caselli 2002 concluded that Dfrac can be used as a chemical clock in star forming regions. Navarro-Almaida et al. (2021) also used the ratio to determine the evolutionary stage and the collapse timescale for TMC1-CP and TMC1-C using simple models of collapse (Priestley et al. 2018) and the chemical model DNautilus (Majumdar et al. 2017), which includes nuclear spin states chemistry. Accordingly, we propose that the large scattering in the values of Dfrac (N2 H+) is more likely related with a higher dependence on the evolutionary stages of the starless cores.
Comparing cores within the same region is more useful for detecting the effect of the starless core evolution on the chemistry, thus avoiding the impact of the environmental conditions. Focusing on each molecular complex, some trends are observed in Fig. 3. In Taurus, the lowest Dfrac is always found in B213-C12-1. On the contrary, B213-C6-1 (followed by C1 and C7 in most cases) has the highest values. These starless cores are located in the northern end of the filament, while B213-C12 is in the southern part, indicating that cores located in the north of B 213 are more chemically evolved than the cores in the south. This trend was also found by Esplugues et al. (2022) and Rodríguez-Baras et al. (2023) for Dfrac (H2CS) and Dfrac (H2S), respectively. A similar conclusion was also drawn in Spezzano et al. (2022b), based on methanol emission studies.
In Perseus molecular complex, IC 348-10 is the starless core with the lowest Dfrac, very likely because its proximity to a cluster containing a pre-main sequence star. The cores L1448-1 and 79-C1-1 have the highest deuteration, reaching values of N2D+/N2H+ = 0.35 ± 0.05 and 0.26 ± 0.04, respectively. Both regions present one of the lowest temperatures in Perseus. In NGC 1333, the core 1333-C5-1 presents the lowest deuterium fraction, suggesting that this is a less evolved object. Low values are also obtained in 1333-C3-1, which could be affected by nearby star formation activity.
Regarding Orion, ORI-C3-1 has lower ratios than the other cores as it is the closest to the HII region, which is heating its surroundings. Our limited core sample in this region prevents us from extracting firm conclusions.
Finally, we compare the average values of Dfrac toward the three different molecular clouds, which allows us to focus on differences driven by environmental conditions rather than interpreting them as evolutionary trends. Fig. 4 shows that Taurus has the highest Dfrac for almost all ratios, being the region with the coldest cores, followed by Perseus and finally Orion A. However, the mean values in Taurus and Perseus remain compatible. One could think that this is the effect of the increasing star formation activity, ambient UV field, and dust temperature from Taurus to Perseus and Orion, as testified by the slight correlation with temperature shown in Fig. B.2, but we need also to keep in mind the different distances of the molecular cloud complexes. Orion is located at a greater distance: ~432 pc. Assuming
a typical starless core size of 2 × 10⁴ au (~0.01 pc) it is equivalent to an angular size of ~5″ at the distance of Orion, which is a factor of ~5 smaller than the beam of our observations. Thus, we are not able to distinguish if the line emission comes from the external or the densest zone, and the emission of deuterated compounds could be more diluted than those of the hydrogenated compounds. In addition, the smaller sample size in this region may be introducing a bias in the mean value of Dfrac as we could be missing the most evolved objects. Higher spatial resolution observations and a larger sample in this molecular cloud are required for a more reliable comparison.
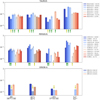 |
Fig. 3 Deuterium fraction ratios in the starless core-sample in the three molecular clouds considered: Taurus, Perseus, and Orion. The sources are ordered by increasing kinetic temperature. Dashed bars indicate upper limits. Green and yellow arrows point out the highest and lowest values of Dfrac, respectively. |
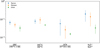 |
Fig. 4 Mean deuterium fraction ratios for each molecular cloud. Error bars represent the standard deviations. |
5.4 14N/15N
Nitrogen isotopic ratios are key tools to trace the chemical history from molecular clouds to planetary systems (Caselli & Ceccarelli 2012). They allow us to study and link properties in the interstellar medium and Solar System objects. Different 14N/15 N values have been found along the different bodies in the Solar System. The ratio measured for the protosolar nebula from the solar wind is ~440 (Marty et al. 2011), similar to the one measured from NH3 in the atmosphere of Jupiter (~450; Fouchet et al. 2004), while an enrichment in 15N is found toward the atmosphere of Earth (~270 for N2, Marty et al. 2011) and comets (~ 172 for HCN, Shinnaka et al. 2016). One could think that the low values of the 14N/15N ratio observed in Earth and comets are due to isotopic fractionation processes occurred during the star and planet formation process. Understanding the isotopic fractionation of 14N/15N in star forming regions can therefore shed some light on the origin of N-bearing compounds of our Solar System. In particular, studying sources similar to the environment where the Sun was born is of paramount importance to disentangle the detailed processes that can lead to the 14N/15N values observed in the solar neighborhood.
Our data allowed us to calculate the 14N/15N in a wide sample of starless cores that can be considered as representative of the initial conditions of the formation of a solar mass star. The values of HCN/HC15N and HNC/H15NC were obtained by both direct and indirect methods: the direct one makes use of estimated HCN, HNC and their 15N-isotoplog column densities, while the indirect method uses 13C-isotopolog emission lines are that supposed to be optically thin. For this second method, N(H13CN)/N(HC15N) = 14N/15N × 12C/13C where we assume 12C/13C = 68. This second method avoids the uncertainties due to opacity effects but it is affected by possible variations of the 12C/13C ratio.
The derived nitrogen isotopic ratio in the sampled starless cores are shown in Table A.9. The isotopolog HC15N was detected in all cores except B213-C5-1, for which a lower limit of H13CN/HC15N is provided. The HNC/H15NC ratios that were obtained using the direct method are not reliable because of the high opacities of the HNC 1→0 line. The fitting of the hyperfine lines of HCN allowed us to estimate the opacity and thus test the reliability of our calculations. Toward ORI-C3-1, 1333-C4-1, and 1333-C5-1, the HCN 1→0 line has low or moderate opacities (see Table A.3). For 1333-C4-1 and 1333-C5-1, the values obtained using the direct and indirect methods are compatible. However, the value derived in ORI-C3-1, using the direct method (850 ± 130) is a factor of ~2 larger than the value obtained using the indirect method (Bizzocchi et al. 2013), suggesting that the 12C/13C ratio can differ from the canonical value in this source (as obtained with HCN/H13CN and DNC/DN13C, see Table A.7). Using the indirect method, we obtained average ratios of (HN13C× 68)/H15NC = 296 and (H13CN× 68)/HC15N = 430. The first one present uniform values across our sources (σ = 64) while variations are detected for the second one (σ = 120). In the following, we comment the variations of the (H13CN× 68)/HC15N ratio in our sample.
In B 213, (H13CN× 68)/HC15N is, on average, higher than in any other molecular complex we observed, being the average ratio 490 and the standard deviation 130. In B213-C12-1 and B213-C10-1 we obtained high values (700 ± 170 and 490 ± 90, respectively), while the cores B213-C1-1 and B213-C2-1 present lower ratios (420 ± 90 and 260 ± 40, respectively). Therefore, we might find a slight increase from north to south of 14N/15N (and then 15N raising toward the north), but uncertainties are too large to draw firm conclusions. Nevertheless, this would be in agreement with the interpretation that there is a 15N enrichment in the more evolved cores. The cores located in the north are those toward which we obtained higher values of Dfrac and also the ones where Esplugues et al. (2022) and Rodríguez-Baras et al. (2023) also found higher values for the deuterium fractions of H2CS and H2 S, respectively, suggesting that these are in a more evolved evolutionary stage.
Perseus presents high variations in the values of HC14N/HC15N, being the standard deviation 120 and the average value 410. The maximum values of (H13CN× 68)/HC15N are found in 1333-C4-1 (660 ± 100), which could be contaminated by a nearby protostar, and 1333-C3-14 (540 ± 90), the most evolved core in our sample, which is not consistent with the scenario of low values of 14N/15N in the more evolved cores. However, we do find a low value (310 ± 50) toward 79-C1-1, which presents also high values of Dfrac in all the studied molecules (this work, Esplugues et al. 2022, Rodríguez-Baras et al. 2023). In this case, isotope-selective photodissociation might also be at work, since this core is located in Barnard 5, an active star formation associated with energetic outflows (Langer et al. 1996).
Regarding Orion, a uniform 14N/15N was found, whose average is 407 and its standard deviation is 19. The maximum ratio (400 ± 60) was reached in ORI-C3-1, while the other two cores present similar values (~350).
Two main mechanisms have been proposed to explain low values of 14N/15N: (i) isotopic fractionation reactions that would change the 14N/15N ratios with time (Roueff et al. 2015). Since we are using the indirect method for our calculations, our results would follow the H13CN/HC15N ratio that is predicted to decrease for longer times. And (ii) selective photodissociation of N2 that would lead to an increase in 15N atoms, and therefore a 15N enrichment of nitriles in regions bathed in enhanced UV fields (Spezzano et al. 2022a; Hily-Blant et al. 2019). We explored which is the dominant mechanism for the variations we found in the H13CN/HC15N ratio by exploring the correlation of this quantity with dust temperature and Dfrac (N2H+) (see Figs. B.3, B.4). If selective photodissociation were driving the 14N/15N ratio, one would expect some correlation between this isotopic ratio and the dust temperature. Indeed, we find weak correlation of H13CN/HC15N with temperature (p-value=0.09), although the correlation is mainly due to the higher values of H13CN/HC15N in B 213. On the contrary, if the 14N/15N ratio were driven by the core evolution, one would expect a tighter correlation with Dfrac (N2 H+), which is not found (p-value=0.2). Our results suggest that although local differences of starless cores in the same region can be explained in terms of core evolution and/or selective photodissociation, none of these mechanisms can explain the results in all the studied regions. The large scattering of the values obtained and the uncertainties in the 12C/13C ratio make it difficult to extract firm conclusions.
6 Chemical modeling: Deuterium fractionation
In order to explore the ability of deuterium fractionation to probe the chemical and dynamical evolution of starless cores, we modeled the chemistry of our targets using the latest version of the three-phase chemical code, DNAUTILUS 2.0 (Kashyap et al. 2024). DNAUTILUS 2.0 has the capability to investigate deuterium fractionation in both two-phase (only gas and grain surface) and three-phase (gas, grain surface, and grain mantle) modes, with the option to include or exclude the ortho-and para-spin states of key hydrogenated species such as H2, H2+, H3+, and their isotopologs. In this study, we utilized the three-phase configuration of DNAUTILUS 2.0, incorporating spin-state chemistry for light hydrogen-bearing species (H2, H2+, H3+) and their isotopologs, as described in Majumdar et al. (2017). DNAUTILUS 2.0 computes the time evolution of chemical abundances while considering the gas, grain surface, and grain mantle phases, as well as their interactions. In our calculations, we assume an initial deuterium abundance of 1.6 × 10⁻⁵ (Linsky 2007), and the initial ortho-to-para ratio of H2 is set to its statistical value of 3 by following Majumdar et al. (2017).
6.1 Exploring the parameter space
To test the sensitivity of deuterium fraction ratios to different physical parameters (density, gas and dust temperature and cosmic ray ionization), we considered a grid of zero-dimensional (0D) DNAUTILUS models adopting different initial conditions, as summarized in Table 3. In all models we adopted the elemental initial abundances as in Majumdar et al. (2017) except for sulfur. Fuente et al. (2023) estimated a sulfur depletion of a factor of ~10 in Taurus and Perseus, and of ~1 in Orion, based on the fitting of the molecular abundances derived from GEMS data. We checked the impact of the assumed initial elemental abundances in our calculations and the changes in D f rac estimates. Varying the initial S+, the differences observed were negligible; therefore we adopted S/H = 1.5 × 10⁻⁶ in all our runs (depletion of a factor of 10). We also tested the sensitivity to the initial form of carbon (C+ or CO) and oxygen and found no substantial variation in D f rac for t>0.1 Myr (typical ages of starless cores). In the case of ortho-to-para ratio of H2, its value always thermalizes to 3 × 10⁻⁵. A model with a low initial ratio (e.g., 10−4) reaches steady state more quickly than one with a value of 3 (see Fig. B.5). However, both models converge to the same Dfrac predictions for t > 0.3 Myr.
Regarding gas density and temperature, we considered representative physical conditions for starless cores: nH2 = 105 cm−3 and 106 cm−3, and T = 7, 10, and 15 K (Fuente et al. 2019; Navarro-Almaida et al. 2021; Rodríguez-Baras et al. 2023). Cosmic rays play a leading role in the chemistry of the interstellar medium. In absence of other ionization agents (X-rays, UV photons, and J-type shocks), the ionization fraction is proportional to the square root of the cosmic ray ionization rate per molecular hydrogen, ζH2, which becomes the key parameter in the molecular cloud evolution (McKee 1989; Caselli et al. 2002; Wakelam et al. 2010). Values ranging from a few 10−18 s−1 to a few 10−17 s−1 have been measured in diffuse and dense interstellar clouds (see, e.g., Padovani et al. 2009), the lower values being measured toward regions with high molecular hydrogen column densities. Fuente et al. (2023) estimated ζH2 ~ 1-50 × 10−17 s−1 in the dense cores within the GEMS sample located in Taurus, Perseus, and Orion. These estimates were in agreement with previous estimates in Barnard 1b by Fuente et al. (2016) and in TMC 1 by Navarro-Almaida et al. (2021). According to these results, we decided to consider two values: ζH2 = 1.3× 10⁻¹⁷ and 1.3× 10⁻¹⁶ s−1, which are representative of the physical conditions in our targets. In total, we ran the 5 models shown in Table 3.
In Fig. 5 we show the predicted Dfrac for N2H+, HNC and HCN over the course of 10 Myr for our set of models. The comparison between models A and B allowed us to study the influence of cosmic ray ionization (ζH2) on Dfrac. Large values of the ζH2 produce slightly lower values of Dfrac in steady state, which is reached at t ≥ 0.1 Myr with these physical conditions. This is consistent with N2D+ being mainly destroyed by dissociative recombination (N2D+ + e− → D + N2) for t ≥ 0.2 Myr (see Table A.10). The value of ζH2 also have an impact on the DNC/DCN isomeric ratio as suggested by Navarro-Almaida et al. 2021. The isomeric ratio, DNC/DCN is predicted to be closer to 1 with model B than with model A.
Gas and grain temperatures (assumed equal in our modeling) have a strong influence on deuteration, determining the time at which steady-state values are achieved, i.e, the deuteration timescale (see Fig. 5). Assuming T = 7 K (model A), the values of Dfrac increase until t ~ 0.3 Myr, when the steady-state is achieved. For model D, with T = 15 K, steady-state values are achieved at t ~ 0.6 Myr, which means a timescale 2 times longer. With T = 10 K, we find an intermediate situation. For temperatures ≤10 K, deuteration mainly proceeds through ion-neutral reactions of H2D+, D2H+, and D3+ with different compounds (see Table A.10). All these deuterated ions are formed by H-D substitution reactions of H3+, and then H2D+, with HD, producing a progressive deuteration. These reactions are favored at low temperatures. Moreover, the parent ion, H3+, is rapidly destroyed through reactions with CO. The CO depletion in these cold regions increases the H3+ abundance and consequently, the formation of its deuterated forms. At moderate temperatures (~ 15 K), there are other isotopic fractionation reactions that can contribute to increase the value of D f rac. This is the case of the formation of N2D+ in model C. At T = 15 K, the reaction N2H+ + D → N2D+ + H is an important N2D+ formation route (see Table A.10). The high sensitivity of the Dfrac to temperature conditions is used as a tracer of the evolution of dense gas, since an accurate chemical age estimation requires precise knowledge of the physical conditions.
Finally, we explore the influence of density on the deuteration of HCN, HNC, and N2 H+ by comparing models A and E. Higher values of density have a high impact on the highest values of Dfrac obtained and also, on the time at which these values are achieved. Changing the density from 105 cm−3 (model A) to 106 cm−3 (model E) leads to an increase in the values of Dfrac by a factor of a few. Moreover, these high values of Dfrac are achieved in a short timescale, t ~104 yr. Again this shorter timescale is related to the CO depletion time, which enhances the abundances of H3+ and their deuterated compounds. According to our results in Sect. 4, the densities in our sample have an nH of a few 105 cm−3. Thus, our physical conditions would be closer to model A, B, C, and D.
Initial relative abundances with respect to hydrogen and the model input parameters.
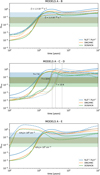 |
Fig. 5 Comparison of the evolution of Dfrac up to 10 Myr according to the different parameters of the models described in Table 3. Shaded horizontal bands indicate the observed range of the deuteration values for N2H+ (blue), HNC (orange), and HCN (green). Vertical dashed lines indicate the time when steady state is reached. |
 |
Fig. 6 Comparison between observations and models C and D to constrain the chemical age of the starless cores. Blue, orange, and green dots represent the different observed deuterium fraction ratios across the core sample. The shadowed areas show the predicted values of the ratios for specific time ranges. The starless cores are ordered within each molecular cloud according to their evolutionary stage. |
6.2 Comparison with observations
In this section, we check the ability of Dfrac to trace the evolutionary stage of our starless cores by comparing our observational results with the different models. As a first step, we show in Fig. B.6 the comparison between the values of Dfrac for all our models in reasonable evolutionary times in between 0.1 and 10 Myr. The predictions of our models in the time range are shown as a color band in each panel, while the values of Dfrac estimated from our observations of HCN, HNC, and N2H+ are indicated by dots. There are two models, model E and model B, that perform poorly when reproducing our observations. This is not unexpected in the case of model E since the densities derived for our DNC observations are significantly lower than the density considered in this run (nH = 106 cm−3). Moreover, model B assumes a relatively high value of ζH2 of 1.3 × 10⁻¹⁶ s−1.
Models A, C, and D are able to reproduce all our observations. However, different evolutionary times are derived depending on which model is used. This is the consequence of the dependence of the deuteration timescale with temperature. As commented in Sect. 6.1 and shown in Fig. 5, the main effect of increasing temperature is to delay the deuteration of DCN, DNC, and N2D+ to longer times. We need to fix the temperature to have reliable evolutionary time estimates. Temperatures ~10 K are measured in B 213 using dust continuum and spectroscopic observations (Hacar et al. 2013; Palmeirim et al. 2013; Marsh et al. 2014).
Assuming T = 10 K, all our values of Dfrac in cores located in Taurus can be reproduced with t ~ 0.2-0.3 Myr (see Fig. 6). Model D, with T = 15 K, is more adequate for Perseus and Orion (Lombardi et al. 2014; Zari et al. 2016), which are more active star formation regions. Using this value, we can reproduce the values measured in all cores of our sample with t ~ 0.3-0.5 Myr.
Within these ranges, deuteration increases very fast, and these are the only temporal windows that reproduce the observed values in each region. With this simple approximation (0D, assumed temperature and density), since deuteration rises with time, it can be used as an evolutionary tracer. In Fig. 6, the cores are ordered according to their evolutionary stage based on Dfrac (N2H+), which is the deuteration with the largest variations and therefore is more suitable for tracing evolution. The most evolved cores in Taurus appear to be B213-C1-1, B213-C6-1, and B213-C16-1, while in Perseus, they seem to be L1448-1, 79-C1-1, 1333-C4-1, and 1333-C3-14. We note that once the steady state is reached, core evolution could no longer be assessed with these deuterated species, and it is only possible to give lower time limits, but the cores in our sample have not yet reached this state. Given that the derived ages are temperature-dependent, more complex models would be required to accurately constrain the age. Nevertheless, the cores classified as more evolved based on deuteration are those with higher n(DNC)/n(CS) (see cores with n(DNC)/n(CS) > 4 in Fig. 1). Therefore, although our model is simple, the derived evolutionary scale is supported by additional indicators, suggesting that it is not far from reality.
To summarize, our modeling is able to successfully reproduce the values of Dfrac of HCN, HNC, and N2H+ for the 23 cores of our sample located in Taurus, Perseus, and Orion. Not unexpected, our results confirm the goodness of Dfrac to estimate the evolutionary time of starless cores as long as temperature and density are accurately known. Using Dfrac (HCN), Dfrac (HNC), and Dfrac (N2H+), we estimate ages of t ~ 0.2-0.3 Myr in the cores located in the filament B 213. In the case of Perseus and Orion, where higher gas and dust temperatures are expected, we need t ~ 0.3-0.5 Myr to account for observations. These ages are consistent with the ones derived for Taurus by other authors using chemical diagnostics (Loison et al. 2020; Spezzano et al. 2022b) and the results obtained in other low-mass star forming regions (Könyves et al. 2015 for densities ~105 cm−3, Wakelam et al. 2021). The differences in the starless core ages found in the different regions are affected by the adopted temperatures and densities. This introduces uncertainties in the derived ages. Despite this, the good agreement between model predictions and observations, in such a large sample of starless cores, located in regions with different star formation activity, suggests that our model is robust and successfully accounts for the processes involved in molecular deuteration.
7 Changes in the 14N/15N ratio during star formation
The interest in nitrogen fractionation processes has increased in recent years, as a tool to establishing the degree to which planetary systems inherit their chemical composition from their parent interstellar clouds. The 14N/15N isotopic ratios measured in the Solar System present a complex picture, with values ranging from 441 in Jupiter and the proto-Sun, down to approximately 50 in micron-sized inclusions in chondrites (Bonal et al. 2010). Despite the observational and theoretical efforts aimed to answer this question, the origin of nitrogen isotopic ratios measured in our planetary system remains elusive (Hily-Blant et al. 2013; Füri & Marty 2015). Moreover, care must be taken when comparing the 4.6 Gyr-old protosolar nebula to present-day star-and planet-forming regions since stellar nucleosynthesis, or the migration of the Solar System from a different Galactocentric radius (Minchev et al. 2013; Martínez-Barbosa et al. 2015), could change the isotopic ratio. Isotopic ratios well below from ~441, to as low as ~270, have been measured in the diffuse (Lucas & Liszt 1998) and dense (Adande & Ziurys 2012; Hily-Blant et al. 2013; Daniel et al. 2013) molecular gas in the local interstellar medium. Hily-Blant et al. (2017) and Hily-Blant et al. (2019) proposed that the isotopic ratio in the local interstellar medium is ~330, i.e., lower than the protosolar value of 441. A low isotopic ratio in the solar neighborhood has received further observational support from observations in massive star forming regions (Kahane et al. 2018; Colzi et al. 2018a,b). Most of these observations, however, come from active star forming regions where the gas has been heavily processed. Yet, measurements of the 14N/15N ratio in starless and pre-stellar cores remain scarce, clearly insufficient to establish firm conclusions on the initial value of nitrogen fractionation in the star formation process.
In this paper we present observations of the HCN/HC15N and HNC/H15NC ratios toward 23 starless cores. On average, we obtained HCN/HC15N = 430 ± 120 and HNC/H15NC = 296 ± 64. The value of HNC/H15NC is quite uniform along our sample within the dispersion. However, the value of HCN/HC15N is weakly correlated with the temperature (see Fig. B.3). Thus, our data suggest that isotopic fractionation could depend on the environmental conditions. In Fig. 7, we compared the R14N/15N defined as (68×H13CN)/HC15N in our sample with the values obtained in previous works, as well as those found toward low-mass protostars, protoplanetary disks and Solar System bodies. In order to make this comparison as reliable as possible, in this figure we used the published column densities of H13CN and HC15N to estimate R14N/15N instead of using the value of the nitrogen fractions given by the authors. In this way, we are using the same approximation in all the objects. We find a large dispersion in the values of R14N/15N thus estimated, ranging from ~700 in B213-C12-1 to ~260 in B213-C2-1, the later being more consistent with the values measured in protostars. Interestingly, eight cores present R14N/15N > 441, and half of them are located in B 213. One could think that these surprisingly high values of R14N/15N are the consequence of assumed value of the 12C/13C ratio. Indeed, some starless core in B 213 present DNC/DN13C < 68 ±15 (see Fig. 2). In order to test this possibility, we recalculated R14N/15N assuming that HCN/H13CN ratio is the same as the estimated DNC/DN13C in the cores of our sample. The average value of this R14N/15N for the cores where DN13C is detected is 332, similar to the ISM value of 330 (Hily-Blant et al. 2019).
Gas fractionation reactions, selective photodissociation, and selective adsorption and diffusion on the grain surfaces can alter the isotopic fractionation. Hily-Blant et al. (2020) presented time dependent calculations of the evolution of the 14N/15N isotopic ratio of several species during the early phases of the gravitational collapse. They concluded that enrichment of 15N-containing species can occur during the collapse due to the higher mass of 15N species and hence a lower rate of thermal collisions with grains and therefore adsorption to grains. However, the impact of gas-phase fractionation reactions in the 14N/15 N isotopic ratio should be low during gravitational collapse because the timescales for isotopic fractionation seem to be longer than those for core collapse (Hily-Blant et al. 2020). This is consistent with the lack of correlation between R14N/15N and Dfrac (N2 H+) in our sample as shown in Fig. B.4. Selective photodissociation has also been proposed to explain low values of the 14N/15N ratio in starless cores. Indeed, selective photodissociation might explain the variation of the HC14N/HC15N in B 213. The HC14N/HC15N ratio is lower in the northern part of the filament where the protostars density is higher. However, when we considered the whole of our sample, we find a weak correlation of the HC14N/HC15N ratio with temperature, which is contrary to that expected if selective photodissociation were driving R14N/15N. This suggests that selective photodissociation is not the main agent driving R14N/15N in our sample of starless cores.
As shown in Fig. 7, R14N/15N decreases not only during the collapse but also during the protostellar phase: starless cores present the highest values of R14N/15N, with a mean value of 429; in the next phase (protostars) R14N/15N was reduced by 37% to an average value of 270, and even more so in protoplanetary disks (by 72%), where the mean value is 120. This trend is different from that observed in the case of deuteration, for which the D/H values observed in protostars are similar to those in starless cores, suggesting that it is settled during the gravitational collapse (see Fig. B.7). We should bear in mind that the protostars considered in Fig. B.7 are mostly Class 0, i. e., objects embedded in a cold and dense envelope, still unaffected by the recently born star; a greater decrease in deuterium fraction would be expected in more evolved protostars. On the contrary, R14N/15N evolves during the whole process of star and planet formation with a variation of a factor of ∼4 between starless cores and protoplanetary disks. However, it should be noted that the observations of R14N/15N in Class 0 and I protostars and protoplanetary disks are still scarce and could be biased by regions, insufficient for a reliable statistics. Also important, the 14N/15N ratio is expected to vary for different species depending on their formation routes and the chemical history of the cloud (Sipilä et al. 2023). High angular observations of the 14N/15N ratio in different species toward young protostars and protoplanetary disks are needed to disentangle the underlying chemistry. In addition, detailed chemo-dynamical models fully accounting for the surface chemistry are required to further understand the evolution of nitrogen fractionation and the possible link between the values measured in molecular clouds and those in the Solar System bodies.
 |
Fig. 7 14N/15N from (68 × H13CN)/HC15N at different evolutionary stages, from cores to protoplanetary disks. Measures from comets, Earth, and Jupiter are also considered. Light blue dots represent our results using the 12C/13C derived from DNC/DN13C instead of the fixed ratio of 68. Dashed lines show the average values of each state. The local ISM value of ~330 (Hily-Blant et al. 2019) is represented with pink dashed lines. References: (1) Navarro-Almaida et al. (2023); (2) Jensen et al. (2024); (3) Yoshida et al. (2019); (4) Wampfler et al. (2014); (5) Guzmán et al. (2017); (6) Bockelée-Morvan et al. (2008); (7) Fouchet et al. (2004); (8) Owen et al. (2001). |
8 Summary and conclusions
In this work, we have presented a chemical study of 23 cores in the star-forming regions of Taurus, Perseus, and Orion. Using millimeter IRAM 30 m observations and the radiative transfer code RADEX, we obtained the column densities of HCN, HNC, N2H+, and their isotopologs to study their evolution and chemistry through molecular isotopic and isomeric ratios. Our conclusions are outlined as follows:
We have obtained an average 12C/13C ratio from DNC/DN13C of 49 ± 13, which is consistent with the ISM value of 68 ± 15 as measured from CN.
Our results for the isomeric ratios H13CN/HN13C, HC15N/H15NC, and DCN/DNC are in good agreement with the expected value of ∼1 for cold cores.
We studied deuterium fractionation through DNC/HNC, DCN/HCN, and N2D+/N2H+, and their average values are 0.054 ± 0.019, 0.036 ± 0.033, and 0.15 ± 0.11, respectively. The deuterium fractions of the three species show a weak correlation with temperature, with Dfrac (N2 H+) presenting the greatest amount of scattering. The starless cores that present the highest (lowest) deuteration are B213-C1-1 and B213-C6-1 (B213-C12-1) in Taurus and L1448-1 and 79-C1-1 (IC348-10) in Perseus. When comparing the three different molecular clouds instead, we shifted our attention to the environmental effects. We found the highest deuterations in Taurus, with more quiescent properties than Perseus and Orion.
We found that the 14N/15N is different between HCN/HC15N (∼430) and HNC/H15NC (∼300). No correlation was found between these ratios and deuterium fractions. While the local variations among starless cores within the same region can be attributed to core evolution and/or selective photodissociation, these mechanisms alone cannot explain the results in all the studied regions.
We used DNAUTILUS 2.0 to model the deuteration of HCN, HNC, and N2H+ in our sample. In Taurus, a model with nH2=105 cm−3, T = 10 K, and ζH2 = 1.3 10−17 s−1 reproduces the observed Dfrac values in the cores located in Taurus for t ∼ 0.2–0.3 Myr. In Perseus and Orion, where temperatures are slightly higher (T = 15 K), we obtained a chemical age of 0.3–0.5 Myr. As the derived ages are temperaturedependent with this 0D model, more complex models would be required to accurately constrain the age. Nevertheless, since deuteration increases with time, we used Dfrac (N2H+) as an evolutionary tracer, and the cores classified as more evolved (B213-C1-1, B213-C6-1, and B213-C16-1 in Taurus and L1448-1, 79-C1-1, 1333-C4-1, and 1333-C3-14 in Perseus) also present higher n(DNC)/n(CS).
When comparing our HCN/HC15N results (using the indirect method, ∼430) with those obtained in the literature in sources at different evolutionary stages, we observed an apparent decreasing trend toward protostars (∼270) and pro-toplanetary disks (∼120). In contrast, deuterium fractions in protostars remain similar to those in starless cores. This suggests that the 15N enrichment of HCN proceeds during the protostellar phase until the formation of the protoplane-tary disk, whereas Dfrac is established during gravitational collapse. Selective adsorption on grain surfaces during the Class 0 phase and selective photodissociation in the more evolved Class I protostars could contribute to this HC15 N enhancement.
Isotopic ratios have been used as chemical diagnostics to investigate the origin of material in the Solar System. In this work, we used data from the large IRAM 30 m program GEMS and an additional IRAM 30 m project to constrain the D/H isotopic ratios of HCN, HNC, and N2H+ as well as the 14N/15N ratio of HCN and HNC in a sample of 23 cores located in the star forming regions of Taurus, Perseus, and Orion. We used the chemical code DNautilus to determine the evolutionary stage of the cores from the observed values. Our large sample size allowed us to investigate the possible influence of the environment on the isotopic ratios. Since the deuterium fractionation of HCN, HNC, and N2H+ depends on the evolutionary stage of the core and the environment, we can use the deuterium fractions as chemical clocks in starless cores with similar initial conditions. The HNC/H15NC and HCN/HC15N are not correlated with Dfrac, suggesting that the detected variations are not correlated with the evolutionary stage of the core. Although, with a large dispersion, the average value of the HCN/HC15N ratio in our sample is significantly higher than the values measured in protostars and protoplanetary disks, suggesting that nitrogen fractionation processes take place during the protostellar phase.
Acknowledgements
This project has received funding from the European Research Council (ERC) under the European Union's Horizon Europe research and innovation programme ERC-AdG-2022 (GA No. 101096293). Funded by the European Union. Views and opinions expressed are however those of the author(s) only and do not necessarily reflect those of the European Union or the European Research Council Executive Agency. Neither the European Union nor the granting authority can be held responsible for them. A.F., G.E., and M.R.B. also thanks project PID2022-137980NB-I00 funded by the Spanish Ministry of Science and Innovation/State Agency of Research MCIN/AEI/10.13039/501100011033 and by “ERDF A way of making Europe”. L.M. acknowledges the financial support provided by DAE and the DST-SERB research grant (MTR/2021/000864) from the Government of India for this work. This research has made use of spectroscopic and collisional data from the EMAA database (https://emaa.osug.fr and https://dx.doi.org/10.17178/EMAA). EMAA is supported by the Observatoire des Sciences de l’Univers de Grenoble (OSUG).
Appendix A Additional tables
Spectroscopic information of the observed transitions in each project.
Parameters obtained from Gaussian fits.
Parameters obtained from hyperfine structure fits.
Density of H2, column density and opacity of DNC and HN13C.
Column densities of molecules with unresolved hyperfine structure, N (in cm−2).
Column densities of molecules with resolved hyperfine structure, N (in cm−2).
12C/13C and isomeric ratios, with the mean and standard deviation values.
Deuterium fraction ratios, with the mean and standard deviation values.
14N/15N ratios, with the mean and standard deviation values.
Main production and destruction reactions of N2D+, DNC, and DCN at 2 × 10⁵ yr and 106 yr for models C and D.
Appendix B Additional figures
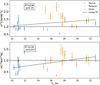 |
Fig. B.1 Comparison between isomeric ratios and gas temperature. A linear fit, the correlation coefficient R2 and the p-value are also represented. |
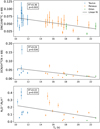 |
Fig. B.2 Comparison between the deuterium fractionation and gas temperature. A linear fit, the correlation coefficient R2, and the p-value are also represented. |
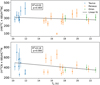 |
Fig. B.3 Comparison between the 14N/15N ratio and gas temperature. A linear fit, the correlation coefficient R2, and the p-value are also represented. |
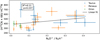 |
Fig. B.4 Comparison between the 14N/15N ratio and deuterium fractionation. A linear fit, the correlation coefficient R2, and the p-value are also represented. |
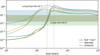 |
Fig. B.5 Comparison of the evolution of Dfrac up to 10 Myr according to the initial ortho-to-para ratio of H2. Shaded horizontal bands indicate the observed range of the deuteration values for N2H+ (blue), HNC (orange), and HCN (green). Vertical dashed lines indicate the time when steady state is reached. |
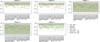 |
Fig. B.6 Comparison between observations and chemical model predictions for chemical ages between 0.1 and 10 Myr. Blue, orange, and green dots represent the different observed deuterium fraction ratios across the core sample. The shadowed areas show the predicted range of values of the ratios from 0.1 Myr to 10 Myr. The sources are ordered by increasing kinetic temperature. |
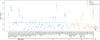 |
Fig. B.7 N2D+/N2H+ at different evolutionary stages from cores to protoplanetary disks. Measure of HDO/H2O from Earth is also considered. Dashed lines represent the average values of each state. References: (1) Navarro-Almaida et al. 2021; (2) Crapsi et al. 2005; (3) Daniel et al. 2013; (4) Emprechtinger et al. 2009; (5) Salinas et al. 2017; (6) Lécuyer et al. 1998. |
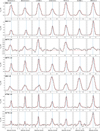 |
Fig. B.8 Line spectra of molecules with unresolved hyperfine structure toward some of the starless cores. The solid red lines show the RADEX best fit to compute column densities. |
References
- Adande, G. R., & Ziurys, L. M. 2012, ApJ, 744, 194 [NASA ADS] [CrossRef] [Google Scholar]
- Albertsson, T., Semenov, D. A., Vasyunin, A. I., Henning, T., & Herbst, E. 2013, ApJS, 207, 27 [CrossRef] [Google Scholar]
- Aléon, J. 2010, ApJ, 722, 1342 [CrossRef] [Google Scholar]
- Ambrose, H. E., Shirley, Y. L., & Scibelli, S. 2021, MNRAS, 501, 347 [Google Scholar]
- André, P., Men’shchikov, A., Bontemps, S., et al. 2010, A&A, 518, L102 [NASA ADS] [CrossRef] [EDP Sciences] [Google Scholar]
- Bacmann, A., Lefloch, B., Ceccarelli, C., et al. 2003, ApJ, 585, L55 [NASA ADS] [CrossRef] [Google Scholar]
- Bernard, J. P., Paradis, D., Marshall, D. J., et al. 2010, A&A, 518, L88 [NASA ADS] [CrossRef] [EDP Sciences] [Google Scholar]
- Bizzocchi, L., Caselli, P., Leonardo, E., & Dore, L. 2013, A&A, 555, A109 [NASA ADS] [CrossRef] [EDP Sciences] [Google Scholar]
- Bockelée-Morvan, D., Biver, N., Jehin, E., et al. 2008, ApJ, 679, L49 [CrossRef] [Google Scholar]
- Bonal, L., Huss, G. R., Krot, A. N., et al. 2010, Geochim. Cosmochim. Acta, 74, 6590 [CrossRef] [Google Scholar]
- Caselli, P. 2002, Planet. Space Sci., 50, 1133 [NASA ADS] [CrossRef] [Google Scholar]
- Caselli, P., & Ceccarelli, C. 2012, A&A Rev., 20, 56 [NASA ADS] [CrossRef] [Google Scholar]
- Caselli, P., Walmsley, C. M., Zucconi, A., et al. 2002, ApJ, 565, 344 [Google Scholar]
- Ceccarelli, C., Caselli, P., Bockelée-Morvan, D., et al. 2014, Deuterium Fractionation: The Ariadne’s Thread from the Precollapse Phase to Meteorites and Comets Today (Tucson: University of Arizona Press) [Google Scholar]
- Colzi, L., Fontani, F., Caselli, P., et al. 2018a, A&A, 609, A129 [NASA ADS] [CrossRef] [EDP Sciences] [Google Scholar]
- Colzi, L., Fontani, F., Rivilla, V. M., et al. 2018b, MNRAS, 478, 3693 [Google Scholar]
- Crapsi, A., Caselli, P., Walmsley, C. M., et al. 2005, ApJ, 619, 379 [Google Scholar]
- Crapsi, A., Caselli, P., Walmsley, M. C., & Tafalla, M. 2007, A&A, 470, 221 [NASA ADS] [CrossRef] [EDP Sciences] [Google Scholar]
- Dalgarno, A., & Lepp, S. 1984, ApJ, 287, L47 [NASA ADS] [CrossRef] [Google Scholar]
- Daniel, F., Dubernet, M. L., Meuwly, M., Cernicharo, J., & Pagani, L. 2005, MNRAS, 363, 1083 [NASA ADS] [CrossRef] [Google Scholar]
- Daniel, F., Gérin, M., Roueff, E., et al. 2013, A&A, 560, A3 [NASA ADS] [CrossRef] [EDP Sciences] [Google Scholar]
- Dislaire, V., Hily-Blant, P., Faure, A., et al. 2012, A&A, 537, A20 [NASA ADS] [CrossRef] [EDP Sciences] [Google Scholar]
- Dumouchel, F., Kłos, J., & Lique, F. 2011, Phys. Chem. Chem. Phys., 13, 8204 [NASA ADS] [CrossRef] [Google Scholar]
- Emprechtinger, M., Caselli, P., Volgenau, N. H., Stutzki, J., & Wiedner, M. C. 2009, A&A, 493, 89 [NASA ADS] [CrossRef] [EDP Sciences] [Google Scholar]
- Endres, C. P., Schlemmer, S., Schilke, P., Stutzki, J., & Müller, H. S. P. 2016, J. Mol. Spectros., 327, 95 [Google Scholar]
- Esplugues, G. B., Cernicharo, J., Viti, S., et al. 2013, A&A, 559, A51 [NASA ADS] [CrossRef] [EDP Sciences] [Google Scholar]
- Esplugues, G., Fuente, A., Navarro-Almaida, D., et al. 2022, A&A, 662, A52 [NASA ADS] [CrossRef] [EDP Sciences] [Google Scholar]
- Fontani, F., Caselli, P., Palau, A., Bizzocchi, L., & Ceccarelli, C. 2015, ApJ, 808, L46 [NASA ADS] [CrossRef] [Google Scholar]
- Foster, J. B., Cottaar, M., Covey, K. R., et al. 2015, ApJ, 799, 136 [NASA ADS] [CrossRef] [Google Scholar]
- Fouchet, T., Irwin, P. G. J., Parrish, P., et al. 2004, Icarus, 172, 50 [CrossRef] [Google Scholar]
- Fuente, A., Cernicharo, J., Roueff, E., et al. 2016, A&A, 593, A94 [NASA ADS] [CrossRef] [EDP Sciences] [Google Scholar]
- Fuente, A., Navarro, D. G., Caselli, P., et al. 2019, A&A, 624, A105 [NASA ADS] [CrossRef] [EDP Sciences] [Google Scholar]
- Fuente, A., Rivière-Marichalar, P., Beitia-Antero, L., et al. 2023, A&A, 670, A114 [NASA ADS] [CrossRef] [EDP Sciences] [Google Scholar]
- Füri, E., & Marty, B. 2015, Nat. Geosci., 8, 515 [CrossRef] [Google Scholar]
- Giers, K., Spezzano, S., Caselli, P., et al. 2023, A&A, 676, A78 [NASA ADS] [CrossRef] [EDP Sciences] [Google Scholar]
- Goldsmith, P. F., Heyer, M., Narayanan, G., et al. 2008, ApJ, 680, 428 [Google Scholar]
- Guzmán, V. V., Öberg, K. I., Huang, J., Loomis, R., & Qi, C. 2017, ApJ, 836, 30 [Google Scholar]
- Hacar, A., Tafalla, M., Kauffmann, J., et al. 2013, A&A, 554, A55 [NASA ADS] [CrossRef] [EDP Sciences] [Google Scholar]
- Hacar, A., Bosman, A. D., & van Dishoeck, E. F. 2020, A&A, 635, A4 [NASA ADS] [CrossRef] [EDP Sciences] [Google Scholar]
- Hatchell, J., Richer, J. S., Fuller, G. A., et al. 2005, A&A, 440, 151 [NASA ADS] [CrossRef] [EDP Sciences] [Google Scholar]
- Hily-Blant, P., Bonal, L., Faure, A., & Quirico, E. 2013, Icarus, 223, 582 [Google Scholar]
- Hily-Blant, P., Magalhaes, V., Kastner, J., et al. 2017, A&A, 603, L6 [NASA ADS] [CrossRef] [EDP Sciences] [Google Scholar]
- Hily-Blant, P., Magalhaes de Souza, V., Kastner, J., & Forveille, T. 2019, A&A, 632, L12 [NASA ADS] [CrossRef] [EDP Sciences] [Google Scholar]
- Hily-Blant, P., Pineau des Forêts, G., Faure, A., & Flower, D. R. 2020, A&A, 643, A76 [NASA ADS] [CrossRef] [EDP Sciences] [Google Scholar]
- Jensen, S. S., Spezzano, S., Caselli, P., et al. 2024, A&A, 685, A149 [NASA ADS] [CrossRef] [EDP Sciences] [Google Scholar]
- Kahane, C., Jaber Al-Edhari, A., Ceccarelli, C., et al. 2018, ApJ, 852, 130 [NASA ADS] [CrossRef] [Google Scholar]
- Kashyap, P., Majumdar, L., Dutrey, A., et al. 2024, ApJ, 976, 258 [Google Scholar]
- Kim, S., Lee, C. W., Gopinathan, M., et al. 2020, ApJ, 891, 169 [Google Scholar]
- Könyves, V., André, P., Men’shchikov, A., et al. 2015, A&A, 584, A91 [Google Scholar]
- Langer, W. D., Velusamy, T., & Xie, T. 1996, ApJ, 468, L41 [NASA ADS] [CrossRef] [Google Scholar]
- Lécuyer, C., Gillet, P., & Robert, F. 1998, Chem. Geol., 145, 249 [Google Scholar]
- Linsky, J. L. 2007, Space Sci. Rev., 130, 367 [CrossRef] [Google Scholar]
- Loison, J.-C., Wakelam, V., Gratier, P., & Hickson, K. M. 2020, MNRAS, 498, 4663 [Google Scholar]
- Lombardi, M., Bouy, H., Alves, J., & Lada, C. J. 2014, A&A, 566, A45 [NASA ADS] [CrossRef] [EDP Sciences] [Google Scholar]
- Lucas, R., & Liszt, H. 1998, A&A, 337, 246 [NASA ADS] [Google Scholar]
- Magalhães, V. S., Hily-Blant, P., Faure, A., Hernandez-Vera, M., & Lique, F. 2018, A&A, 615, A52 [NASA ADS] [CrossRef] [EDP Sciences] [Google Scholar]
- Majumdar, L., Gratier, P., Ruaud, M., et al. 2017, MNRAS, 466, 4470 [Google Scholar]
- Malinen, J., Juvela, M., Rawlings, M. G., et al. 2012, A&A, 544, A50 [NASA ADS] [CrossRef] [EDP Sciences] [Google Scholar]
- Marsh, K. A., Griffin, M. J., Palmeirim, P., et al. 2014, MNRAS, 439, 3683 [NASA ADS] [CrossRef] [Google Scholar]
- Martínez-Barbosa, C. A., Brown, A. G. A., & Portegies Zwart, S. 2015, MNRAS, 446, 823 [Google Scholar]
- Marty, B., Chaussidon, M., Wiens, R. C., Jurewicz, A. J. G., & Burnett, D. S. 2011, Science, 332, 1533 [NASA ADS] [CrossRef] [Google Scholar]
- McKee, C. F. 1989, ApJ, 345, 782 [NASA ADS] [CrossRef] [Google Scholar]
- Melosso, M., Bizzocchi, L., Sipilä, O., et al. 2020, A&A, 641, A153 [NASA ADS] [CrossRef] [EDP Sciences] [Google Scholar]
- Milam, S. N., Savage, C., Brewster, M. A., Ziurys, L. M., & Wyckoff, S. 2005, ApJ, 634, 1126 [Google Scholar]
- Millar, T. J. 2005, Astron. Geophys., 46, 2.29 [NASA ADS] [CrossRef] [Google Scholar]
- Millar, T. J., Bennett, A., & Herbst, E. 1989, ApJ, 340, 906 [NASA ADS] [CrossRef] [Google Scholar]
- Minchev, I., Chiappini, C., & Martig, M. 2013, A&A, 558, A9 [CrossRef] [EDP Sciences] [Google Scholar]
- Müller, H. S. P., Thorwirth, S., Roth, D. A., & Winnewisser, G. 2001, A&A, 370, L49 [Google Scholar]
- Müller, H. S. P., Schlöder, F., Stutzki, J., & Winnewisser, G. 2005, J. Mol. Struc., 742, 215 [Google Scholar]
- Navarro-Almaida, D., Fuente, A., Majumdar, L., et al. 2021, A&A, 653, A15 [NASA ADS] [CrossRef] [EDP Sciences] [Google Scholar]
- Navarro-Almaida, D., Bop, C. T., Lique, F., et al. 2023, A&A, 670, A110 [NASA ADS] [CrossRef] [EDP Sciences] [Google Scholar]
- Owen, T., Mahaffy, P. R., Niemann, H. B., Atreya, S., & Wong, M. 2001, ApJ, 553, L77 [NASA ADS] [CrossRef] [Google Scholar]
- Padovani, M., Galli, D., & Glassgold, A. E. 2009, A&A, 501, 619 [NASA ADS] [CrossRef] [EDP Sciences] [Google Scholar]
- Pagani, L., Salez, M., & Wannier, P. 1992, A&A, 258, 479 [NASA ADS] [Google Scholar]
- Pagani, L., Vastel, C., Hugo, E., et al. 2009, A&A, 494, 623 [NASA ADS] [CrossRef] [EDP Sciences] [Google Scholar]
- Palmeirim, P., André, P., Kirk, J., et al. 2013, A&A, 550, A38 [NASA ADS] [CrossRef] [EDP Sciences] [Google Scholar]
- Parise, B., Ceccarelli, C., Tielens, A. G. G. M., et al. 2002, A&A, 393, L49 [NASA ADS] [CrossRef] [EDP Sciences] [Google Scholar]
- Parise, B., Leurini, S., Schilke, P., et al. 2009, A&A, 508, 737 [NASA ADS] [CrossRef] [EDP Sciences] [Google Scholar]
- Pickett, H. M., Poynter, R. L., Cohen, E. A., et al. 1998, J. Quant. Spec. Radiat. Transf., 60, 883 [Google Scholar]
- Priestley, F. D., Viti, S., & Williams, D. A. 2018, AJ, 156, 51 [NASA ADS] [CrossRef] [Google Scholar]
- Remijan, A. J., Markwick-Kemper, A., & ALMA Working Group on Spectral Line Frequencies 2007, AAS Meeting Abstracts, 211, 132.11 [Google Scholar]
- Roberts, H., Herbst, E., & Millar, T. J. 2003, ApJ, 591, L41 [CrossRef] [Google Scholar]
- Rodgers, S. D., & Charnley, S. B. 2008, MNRAS, 385, L48 [NASA ADS] [CrossRef] [Google Scholar]
- Rodríguez-Baras, M., Fuente, A., Riviére-Marichalar, P., et al. 2021, A&A, 648, A120 [NASA ADS] [CrossRef] [EDP Sciences] [Google Scholar]
- Rodríguez-Baras, M., Esplugues, G., Fuente, A., et al. 2023, A&A, 679, A120 [NASA ADS] [CrossRef] [EDP Sciences] [Google Scholar]
- Roueff, E., Tiné, S., Coudert, L. H., et al. 2000, A&A, 354, L63 [NASA ADS] [Google Scholar]
- Roueff, E., Parise, B., & Herbst, E. 2007, A&A, 464, 245 [NASA ADS] [CrossRef] [EDP Sciences] [Google Scholar]
- Roueff, E., Loison, J. C., & Hickson, K. M. 2015, A&A, 576, A99 [NASA ADS] [CrossRef] [EDP Sciences] [Google Scholar]
- Sakai, N., Ikeda, M., Morita, M., et al. 2007, ApJ, 663, 1174 [Google Scholar]
- Sakai, N., Saruwatari, O., Sakai, T., Takano, S., & Yamamoto, S. 2010, A&A, 512, A31 [NASA ADS] [CrossRef] [EDP Sciences] [Google Scholar]
- Salinas, V. N., Hogerheijde, M. R., Mathews, G. S., et al. 2017, A&A, 606, A125 [NASA ADS] [CrossRef] [EDP Sciences] [Google Scholar]
- Schöier, F. L., van der Tak, F. F. S., van Dishoeck, E. F., & Black, J. H. 2005, A&A, 432, 369 [Google Scholar]
- Shinnaka, Y., Kawakita, H., Jehin, E., et al. 2016, MNRAS, 462, S195 [NASA ADS] [CrossRef] [Google Scholar]
- Sipilä, O., & Caselli, P. 2018, A&A, 615, A15 [Google Scholar]
- Sipilä, O., Colzi, L., Roueff, E., et al. 2023, A&A, 678, A120 [NASA ADS] [CrossRef] [EDP Sciences] [Google Scholar]
- Spezzano, S., Caselli, P., Sipilä, O., et al. 2022a, A&A, 664, L2 [NASA ADS] [CrossRef] [EDP Sciences] [Google Scholar]
- Spezzano, S., Fuente, A., Caselli, P., et al. 2022b, A&A, 657, A10 [NASA ADS] [CrossRef] [EDP Sciences] [Google Scholar]
- Tafalla, M., Santiago-García, J., Myers, P. C., et al. 2006, A&A, 455, 577 [NASA ADS] [CrossRef] [EDP Sciences] [Google Scholar]
- Takano, S., Masuda, A., Hirahara, Y., et al. 1998, A&A, 329, 1156 [NASA ADS] [Google Scholar]
- Turner, B. E. 2001, ApJS, 136, 579 [Google Scholar]
- Vera, M. H., Kalugina, Y., Denis-Alpizar, O., Stoecklin, T., & Lique, F. 2014, J. Chem. Phys., 140, 224302 [CrossRef] [Google Scholar]
- Wakelam, V., Herbst, E., Le Bourlot, J., et al. 2010, A&A, 517, A21 [NASA ADS] [CrossRef] [EDP Sciences] [Google Scholar]
- Wakelam, V., Gratier, P., Ruaud, M., et al. 2021, A&A, 647, A172 [NASA ADS] [CrossRef] [EDP Sciences] [Google Scholar]
- Wampfler, S. F., Jørgensen, J. K., Bizzarro, M., & Bisschop, S. E. 2014, A&A, 572, A24 [NASA ADS] [CrossRef] [EDP Sciences] [Google Scholar]
- Watson, W. D. 1974, ApJ, 188, 35 [NASA ADS] [CrossRef] [Google Scholar]
- Yoshida, K., Sakai, N., Nishimura, Y., et al. 2019, PASJ, 71, S18 [NASA ADS] [CrossRef] [Google Scholar]
- Zari, E., Lombardi, M., Alves, J., Lada, C. J., & Bouy, H. 2016, A&A, 587, A106 [NASA ADS] [CrossRef] [EDP Sciences] [Google Scholar]
- Zucker, C., Speagle, J. S., Schlafly, E. F., et al. 2019, ApJ, 879, 125 [NASA ADS] [CrossRef] [Google Scholar]
The data underlying this article are available at https://github.com/atasa-chaveli/aa54121-25/
GEMS home page: https://www.oan.es/gems/doku.php?id=start
IRAM 30 m efficiencies and beam widths: https://publicwiki.iram.es/Iram30mEfficiencies
All Tables
Initial relative abundances with respect to hydrogen and the model input parameters.
Column densities of molecules with unresolved hyperfine structure, N (in cm−2).
Main production and destruction reactions of N2D+, DNC, and DCN at 2 × 10⁵ yr and 106 yr for models C and D.
All Figures
|
Fig. 1 Comparison between molecular hydrogen densities calculated from DNC in this work and from CS in Rodríguez-Baras et al. 2021. The dashed horizontal line indicates the separation between the more and less evolved cores (see Sect. 6). |
| In the text | |
|
Fig. 2 Comparison between our 12C/13C ratio results (represented with dots; open dots are for the lower limits) and the ISM canonical value of 68 ± 15 (Milam et al. 2005) (shown with a horizontal band). |
| In the text | |
|
Fig. 3 Deuterium fraction ratios in the starless core-sample in the three molecular clouds considered: Taurus, Perseus, and Orion. The sources are ordered by increasing kinetic temperature. Dashed bars indicate upper limits. Green and yellow arrows point out the highest and lowest values of Dfrac, respectively. |
| In the text | |
|
Fig. 4 Mean deuterium fraction ratios for each molecular cloud. Error bars represent the standard deviations. |
| In the text | |
|
Fig. 5 Comparison of the evolution of Dfrac up to 10 Myr according to the different parameters of the models described in Table 3. Shaded horizontal bands indicate the observed range of the deuteration values for N2H+ (blue), HNC (orange), and HCN (green). Vertical dashed lines indicate the time when steady state is reached. |
| In the text | |
|
Fig. 6 Comparison between observations and models C and D to constrain the chemical age of the starless cores. Blue, orange, and green dots represent the different observed deuterium fraction ratios across the core sample. The shadowed areas show the predicted values of the ratios for specific time ranges. The starless cores are ordered within each molecular cloud according to their evolutionary stage. |
| In the text | |
|
Fig. 7 14N/15N from (68 × H13CN)/HC15N at different evolutionary stages, from cores to protoplanetary disks. Measures from comets, Earth, and Jupiter are also considered. Light blue dots represent our results using the 12C/13C derived from DNC/DN13C instead of the fixed ratio of 68. Dashed lines show the average values of each state. The local ISM value of ~330 (Hily-Blant et al. 2019) is represented with pink dashed lines. References: (1) Navarro-Almaida et al. (2023); (2) Jensen et al. (2024); (3) Yoshida et al. (2019); (4) Wampfler et al. (2014); (5) Guzmán et al. (2017); (6) Bockelée-Morvan et al. (2008); (7) Fouchet et al. (2004); (8) Owen et al. (2001). |
| In the text | |
|
Fig. B.1 Comparison between isomeric ratios and gas temperature. A linear fit, the correlation coefficient R2 and the p-value are also represented. |
| In the text | |
|
Fig. B.2 Comparison between the deuterium fractionation and gas temperature. A linear fit, the correlation coefficient R2, and the p-value are also represented. |
| In the text | |
|
Fig. B.3 Comparison between the 14N/15N ratio and gas temperature. A linear fit, the correlation coefficient R2, and the p-value are also represented. |
| In the text | |
|
Fig. B.4 Comparison between the 14N/15N ratio and deuterium fractionation. A linear fit, the correlation coefficient R2, and the p-value are also represented. |
| In the text | |
|
Fig. B.5 Comparison of the evolution of Dfrac up to 10 Myr according to the initial ortho-to-para ratio of H2. Shaded horizontal bands indicate the observed range of the deuteration values for N2H+ (blue), HNC (orange), and HCN (green). Vertical dashed lines indicate the time when steady state is reached. |
| In the text | |
|
Fig. B.6 Comparison between observations and chemical model predictions for chemical ages between 0.1 and 10 Myr. Blue, orange, and green dots represent the different observed deuterium fraction ratios across the core sample. The shadowed areas show the predicted range of values of the ratios from 0.1 Myr to 10 Myr. The sources are ordered by increasing kinetic temperature. |
| In the text | |
|
Fig. B.7 N2D+/N2H+ at different evolutionary stages from cores to protoplanetary disks. Measure of HDO/H2O from Earth is also considered. Dashed lines represent the average values of each state. References: (1) Navarro-Almaida et al. 2021; (2) Crapsi et al. 2005; (3) Daniel et al. 2013; (4) Emprechtinger et al. 2009; (5) Salinas et al. 2017; (6) Lécuyer et al. 1998. |
| In the text | |
|
Fig. B.8 Line spectra of molecules with unresolved hyperfine structure toward some of the starless cores. The solid red lines show the RADEX best fit to compute column densities. |
| In the text | |
Current usage metrics show cumulative count of Article Views (full-text article views including HTML views, PDF and ePub downloads, according to the available data) and Abstracts Views on Vision4Press platform.
Data correspond to usage on the plateform after 2015. The current usage metrics is available 48-96 hours after online publication and is updated daily on week days.
Initial download of the metrics may take a while.