Open Access
Fig. 5
Download original image
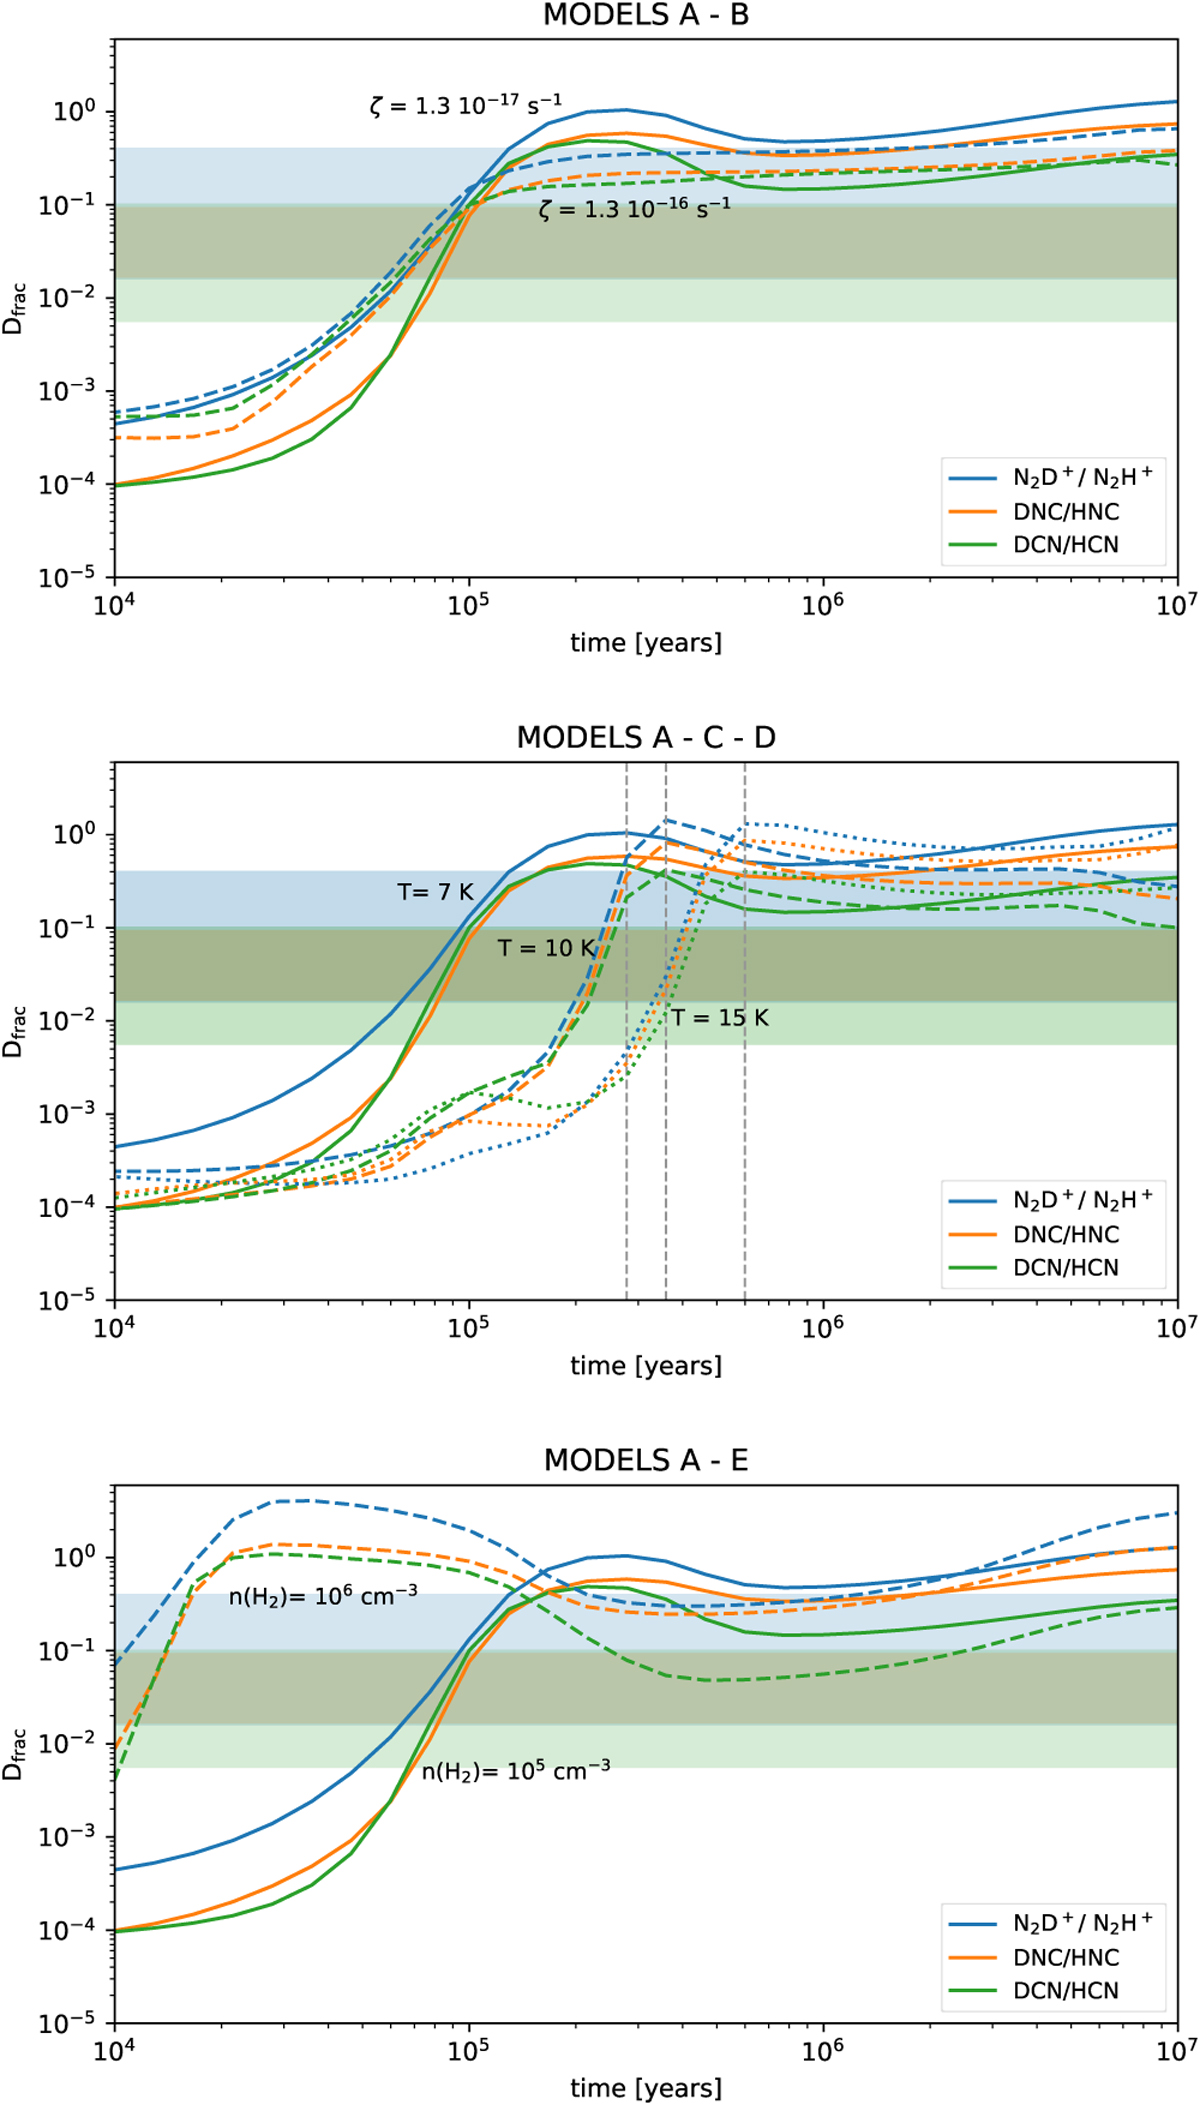
Comparison of the evolution of Dfrac up to 10 Myr according to the different parameters of the models described in Table 3. Shaded horizontal bands indicate the observed range of the deuteration values for N2H+ (blue), HNC (orange), and HCN (green). Vertical dashed lines indicate the time when steady state is reached.
Current usage metrics show cumulative count of Article Views (full-text article views including HTML views, PDF and ePub downloads, according to the available data) and Abstracts Views on Vision4Press platform.
Data correspond to usage on the plateform after 2015. The current usage metrics is available 48-96 hours after online publication and is updated daily on week days.
Initial download of the metrics may take a while.