Fig. 6
Download original image
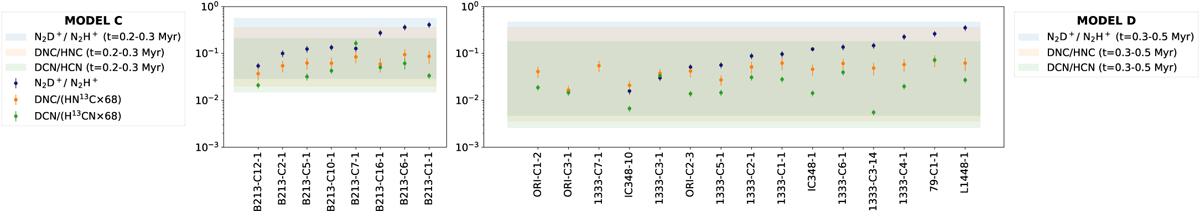
Comparison between observations and models C and D to constrain the chemical age of the starless cores. Blue, orange, and green dots represent the different observed deuterium fraction ratios across the core sample. The shadowed areas show the predicted values of the ratios for specific time ranges. The starless cores are ordered within each molecular cloud according to their evolutionary stage.
Current usage metrics show cumulative count of Article Views (full-text article views including HTML views, PDF and ePub downloads, according to the available data) and Abstracts Views on Vision4Press platform.
Data correspond to usage on the plateform after 2015. The current usage metrics is available 48-96 hours after online publication and is updated daily on week days.
Initial download of the metrics may take a while.