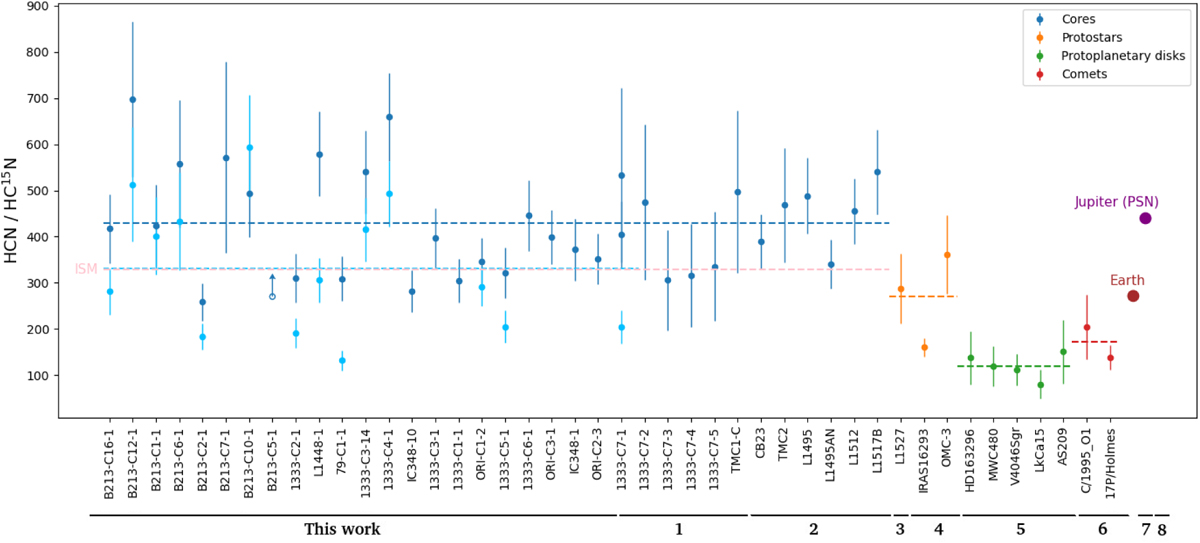
Fig. 7
Download original image
14N/15N from (68 × H13CN)/HC15N at different evolutionary stages, from cores to protoplanetary disks. Measures from comets, Earth, and Jupiter are also considered. Light blue dots represent our results using the 12C/13C derived from DNC/DN13C instead of the fixed ratio of 68. Dashed lines show the average values of each state. The local ISM value of ~330 (Hily-Blant et al. 2019) is represented with pink dashed lines. References: (1) Navarro-Almaida et al. (2023); (2) Jensen et al. (2024); (3) Yoshida et al. (2019); (4) Wampfler et al. (2014); (5) Guzmán et al. (2017); (6) Bockelée-Morvan et al. (2008); (7) Fouchet et al. (2004); (8) Owen et al. (2001).
Current usage metrics show cumulative count of Article Views (full-text article views including HTML views, PDF and ePub downloads, according to the available data) and Abstracts Views on Vision4Press platform.
Data correspond to usage on the plateform after 2015. The current usage metrics is available 48-96 hours after online publication and is updated daily on week days.
Initial download of the metrics may take a while.