Fig. 10
Download original image
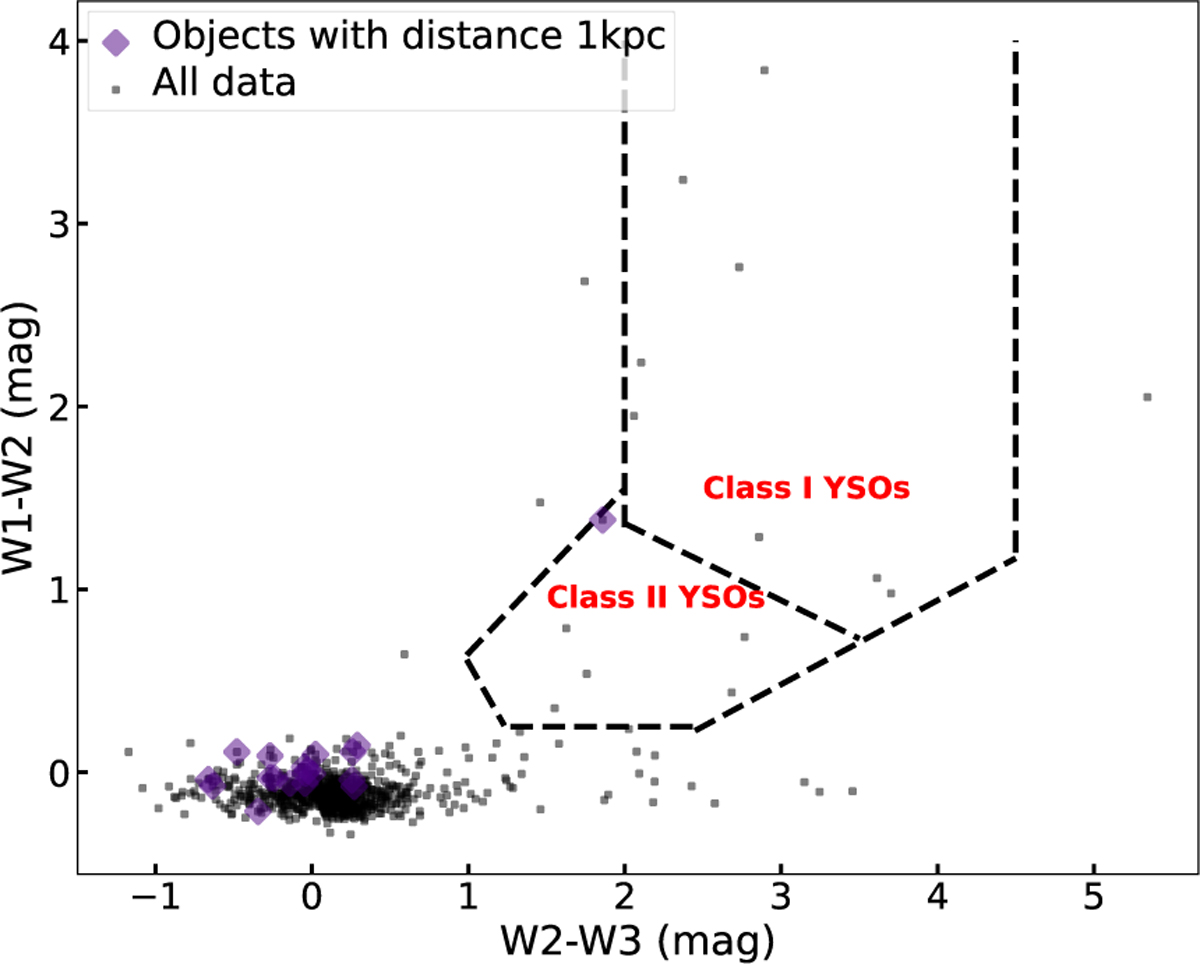
W1–W2 versus W2–W3 color–color diagram of asymptotic giant branch candidates from the SPLICES survey. The areas within the dashed lines are those used by Koenig & Leisawitz (2014) to identify Class I and Class II YSOs. Black dots represent all the data from SPLICES, and purple diamonds indicate objects within a distance of 1 kpc.
Current usage metrics show cumulative count of Article Views (full-text article views including HTML views, PDF and ePub downloads, according to the available data) and Abstracts Views on Vision4Press platform.
Data correspond to usage on the plateform after 2015. The current usage metrics is available 48-96 hours after online publication and is updated daily on week days.
Initial download of the metrics may take a while.