Fig. 11
Download original image
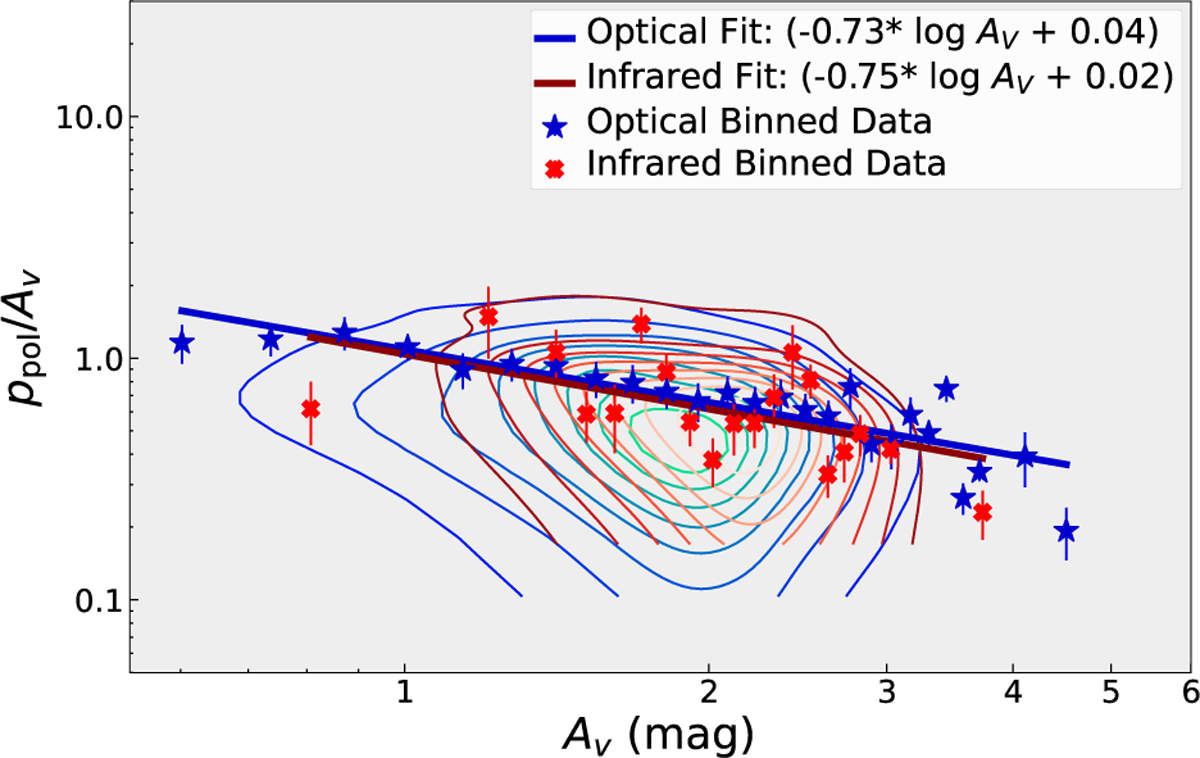
Scatter plots of the polarization efficiency (ppol/AV) as a function of the visual extinction (AV) in magnitudes in logarithmic scale. Measurement uncertainties are displayed as an error bar for each data point. Solid lines are the best fit for the datasets, as explained in the main text. Contours represent levels of constant probability density estimated using a 2D kernel density estimation of the data (using the seaborn Python library; Waskom 2021). These contours indicate where the data points are most densely concentrated. Both sets of contours span density levels from 0 to 0.8, with steps of 0.1, effectively highlighting regions of high and low data concentration. The best-fit parameters are shown in the top-right corner.
Current usage metrics show cumulative count of Article Views (full-text article views including HTML views, PDF and ePub downloads, according to the available data) and Abstracts Views on Vision4Press platform.
Data correspond to usage on the plateform after 2015. The current usage metrics is available 48-96 hours after online publication and is updated daily on week days.
Initial download of the metrics may take a while.