Fig. 3
Download original image
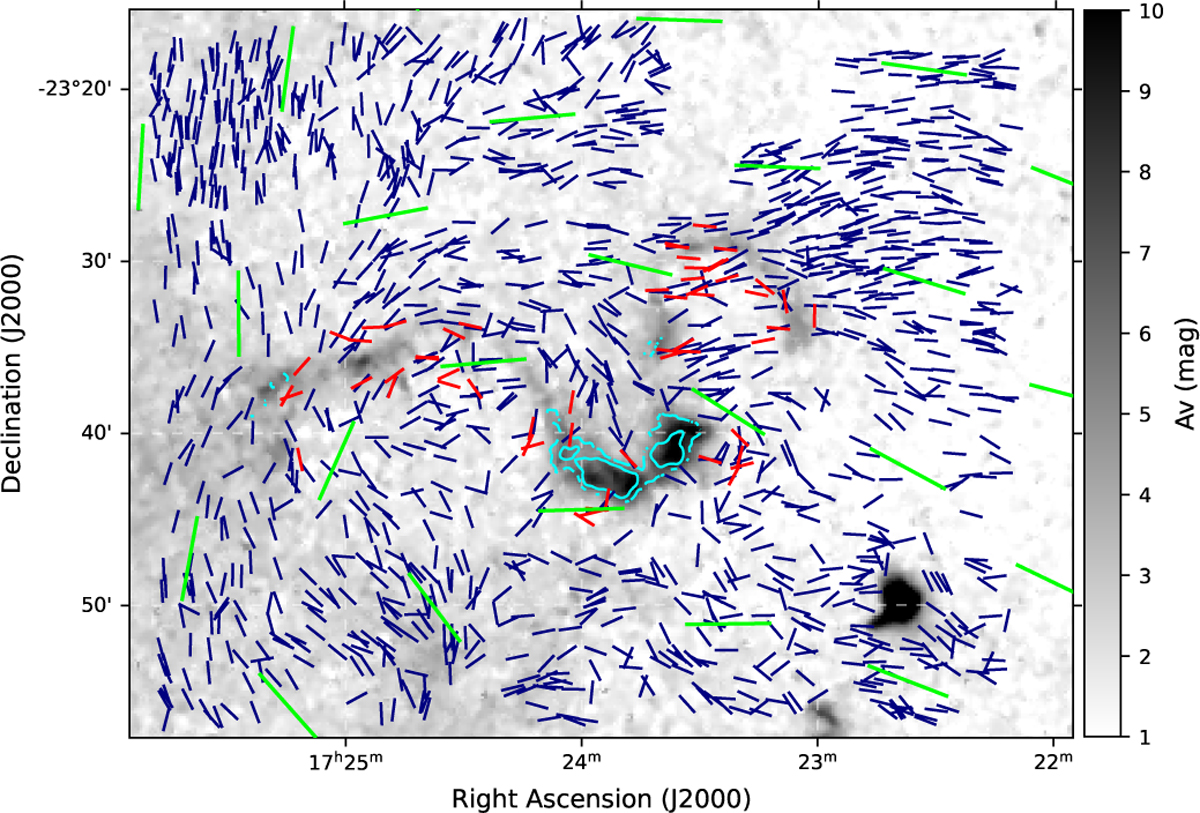
Dust extinction map of the Snake region in color scale at a spatial resolution of 20″ from Román-Zúñiga et al. (2010). All segments represent the B-field orientation. Blue and red segments are inferred from the optical and NIR data, respectively, with S/N≥3. The green segments show the magnetic field orientation from Planck data at the resolution of 10′. The vectors are scaled to the same size to enhance visualization clarity. The cyan contours represent the C18O (1-0) integrated intensity at levels of 0.8 K km/s and 1.6 K km/s.
Current usage metrics show cumulative count of Article Views (full-text article views including HTML views, PDF and ePub downloads, according to the available data) and Abstracts Views on Vision4Press platform.
Data correspond to usage on the plateform after 2015. The current usage metrics is available 48-96 hours after online publication and is updated daily on week days.
Initial download of the metrics may take a while.