Fig. 5
Download original image
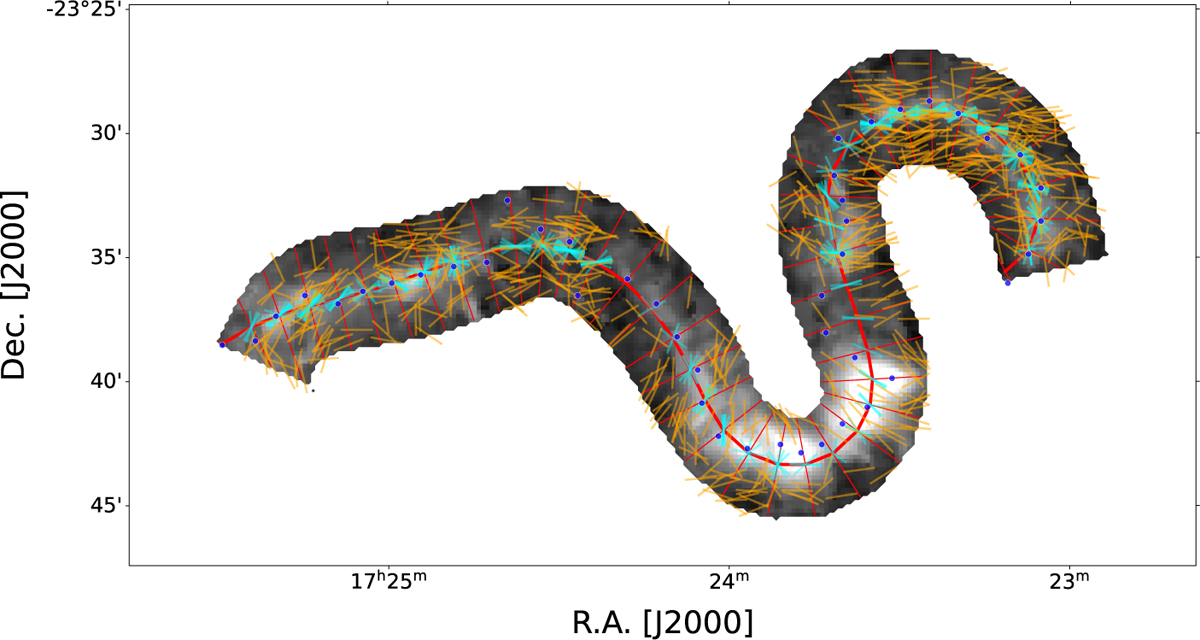
Dust extinction map illustrating the masked filamentary structure. The spine of the filament is outlined by a prominent red curve, and the thin red lines indicate the locations of perpendicular cuts. Blue circles represent the peak pixel intensity along each cut. The orange vectors represent optical (S/N≥5) and infrared (S/N≥3) polarization segments. The cyan vectors are projections of all the orange polarization vectors onto the spine. Each polarization vector was projected by finding its closest point on the spine and shifting it accordingly.
Current usage metrics show cumulative count of Article Views (full-text article views including HTML views, PDF and ePub downloads, according to the available data) and Abstracts Views on Vision4Press platform.
Data correspond to usage on the plateform after 2015. The current usage metrics is available 48-96 hours after online publication and is updated daily on week days.
Initial download of the metrics may take a while.