Fig. 8
Download original image
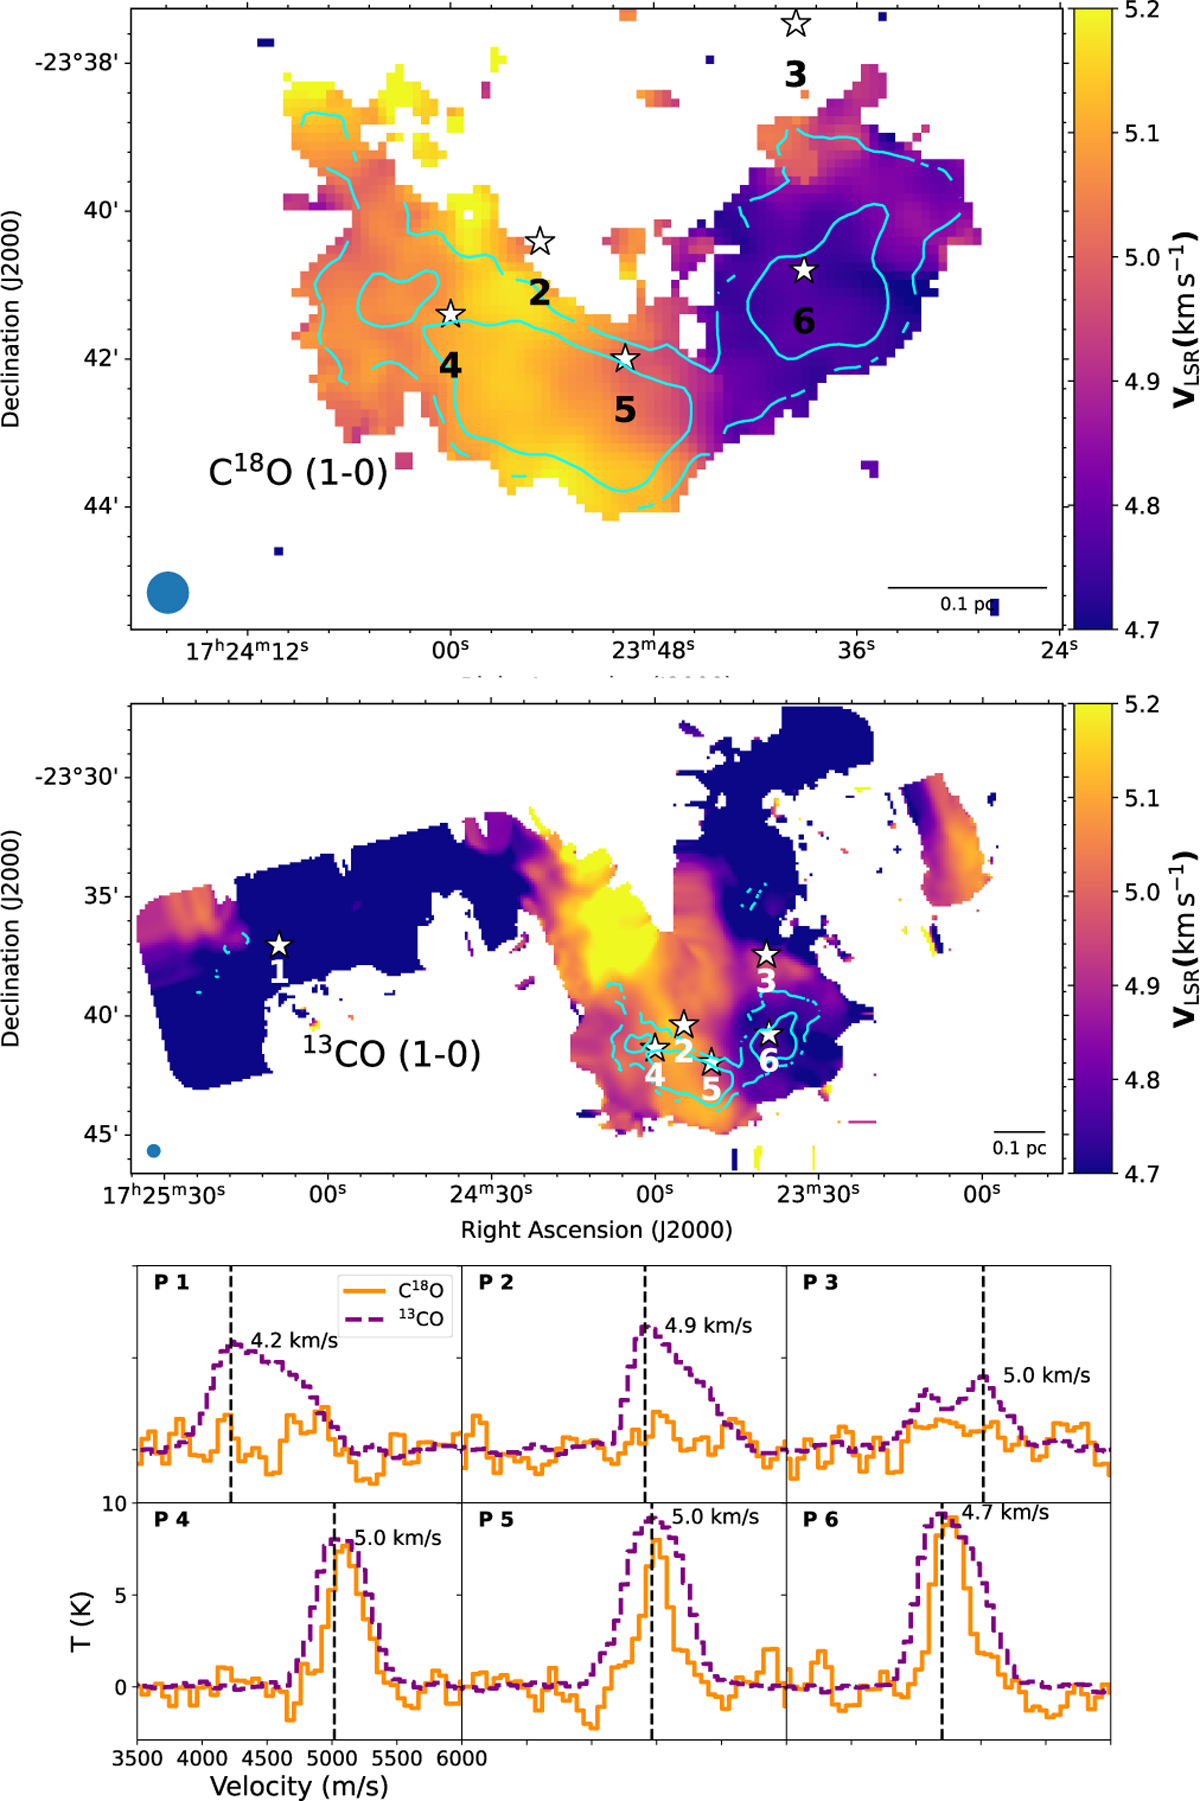
Top panel: centroid velocity map of the C18O (1-0) line. Middle panel: Centroid velocity map of the 13CO (1-0) line. In both maps, we highlight six selected profiles at specific positions along the Snake, marked by white stars. The cyan contours represent the C18O (1-0) integrated intensity at levels of 0.8 K and 1.6 K. The beam size is shown in the bottom-left corner, and the scale bar in the bottom-right. Bottom panel: comparison of the six spectral profiles corresponding to the positions marked by white stars in both maps. The dashed orange profiles represent the C18O (1-0) line multiplied by 5, and the solid purple profiles correspond to the 13CO (1-0) line. The dashed black lines indicate the peak velocity of the 13CO (1-0) line, with the velocity values labeled next to them.
Current usage metrics show cumulative count of Article Views (full-text article views including HTML views, PDF and ePub downloads, according to the available data) and Abstracts Views on Vision4Press platform.
Data correspond to usage on the plateform after 2015. The current usage metrics is available 48-96 hours after online publication and is updated daily on week days.
Initial download of the metrics may take a while.