Fig. 9
Download original image
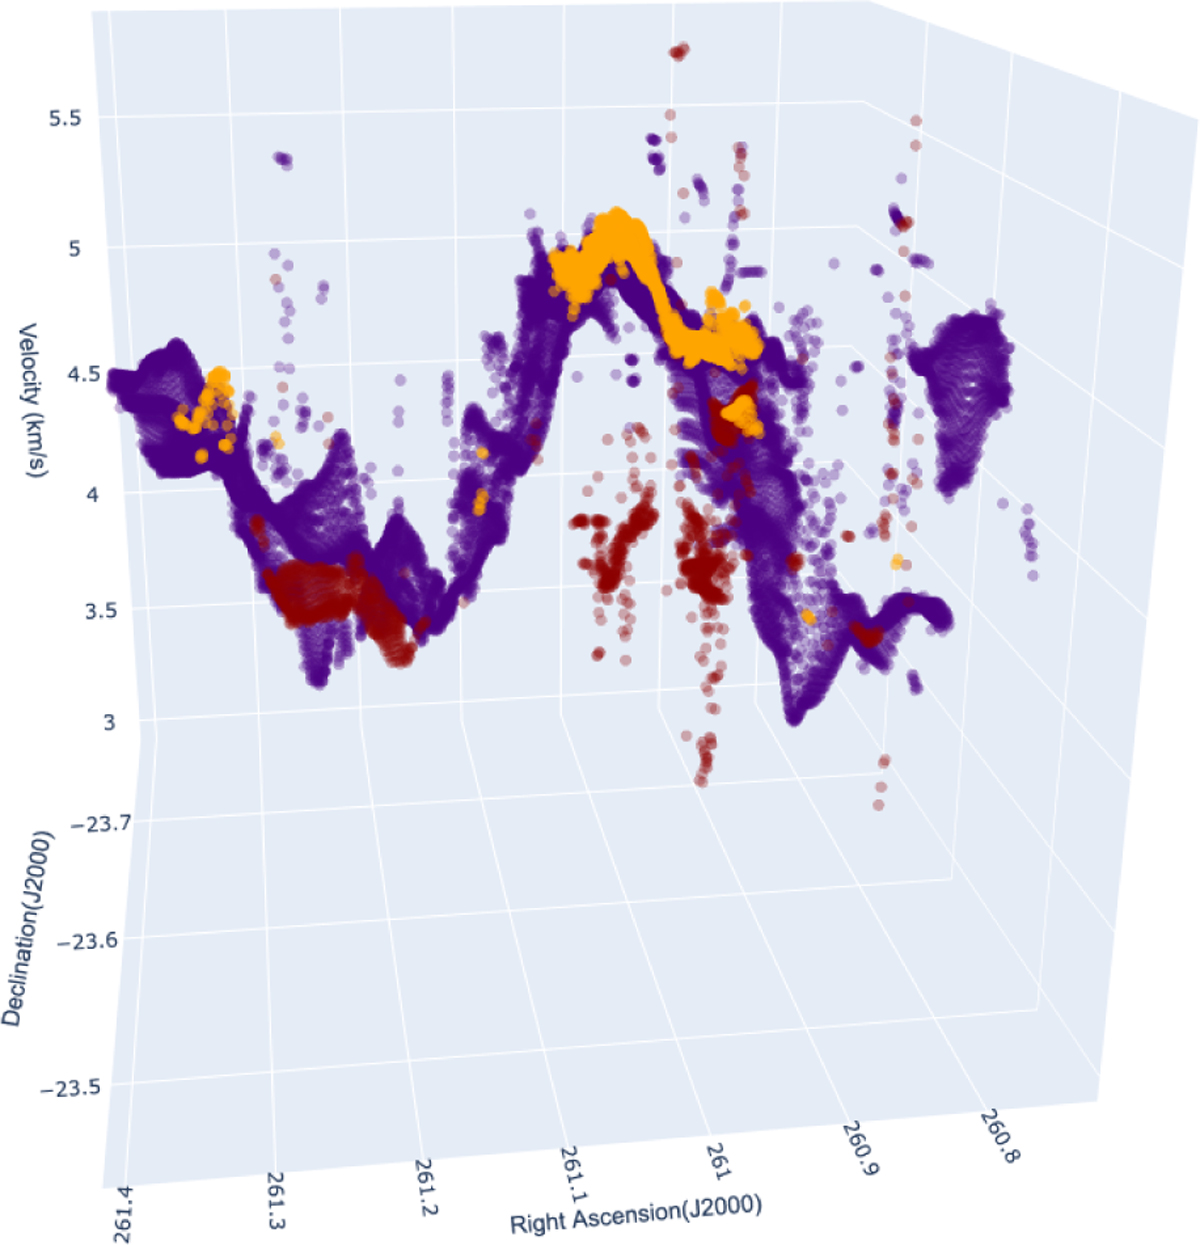
Position-position-velocity plot illustrating the kinematics of the 13CO (1-0) and C18O (1-0) lines. Each data point represents the spatial location and centroid velocity of a Gaussian component, with colors distinguishing different Gaussian fits. The centroid velocity of the C18O (1-0) line is shown in orange, while the purple and red points correspond to the brighter and fainter intensity components of the 13CO (1-0) line, respectively.
Current usage metrics show cumulative count of Article Views (full-text article views including HTML views, PDF and ePub downloads, according to the available data) and Abstracts Views on Vision4Press platform.
Data correspond to usage on the plateform after 2015. The current usage metrics is available 48-96 hours after online publication and is updated daily on week days.
Initial download of the metrics may take a while.