Fig. 1.
Download original image
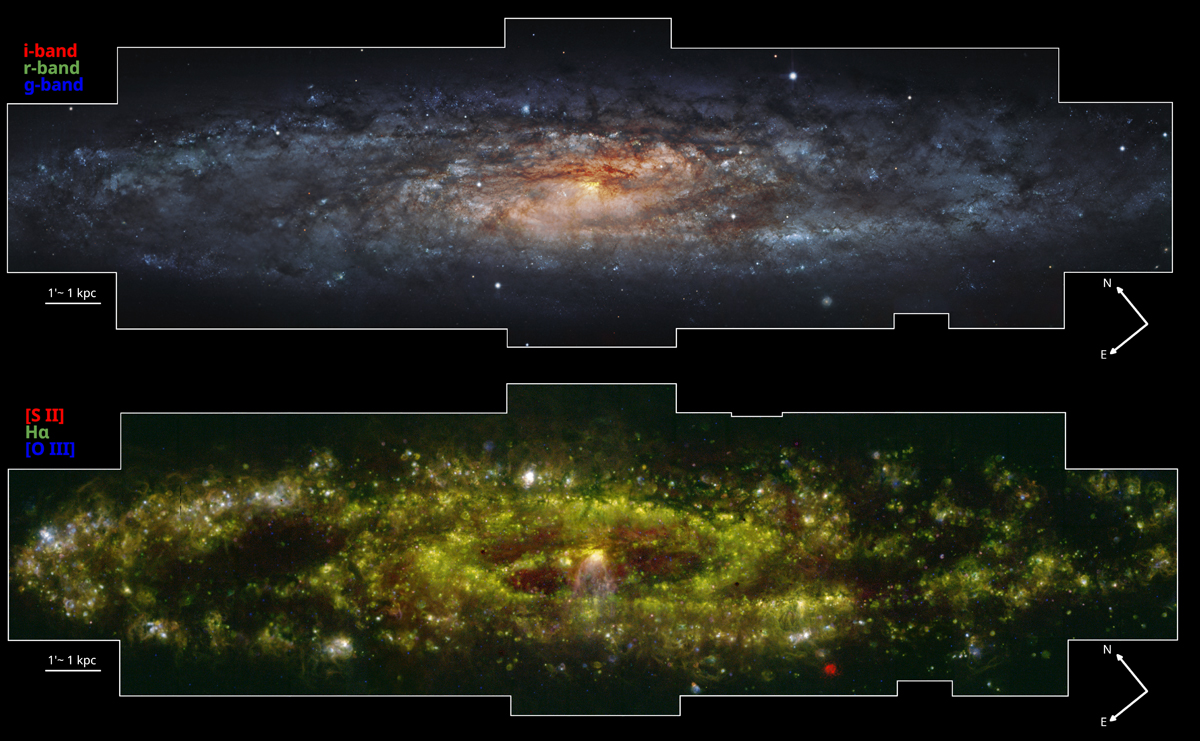
Colour images of NGC 253 produced by combining broad-band images and emission-line maps extracted from the MUSE data cube. The mosaic covers an area of 20 × 5 arcmin2, and it includes roughly nine million independent spectra. The top panel shows a composition of three broad-band filters. The g band is plotted in blue, the r band in green, and the i band in red (Acknowledgement: ESO/M. Kornmesser). The bottom panel is a composition of emission line maps with [O III]λ 5007 in blue, Hα in green and [S II]λλ 6717,6731 in red.
Current usage metrics show cumulative count of Article Views (full-text article views including HTML views, PDF and ePub downloads, according to the available data) and Abstracts Views on Vision4Press platform.
Data correspond to usage on the plateform after 2015. The current usage metrics is available 48-96 hours after online publication and is updated daily on week days.
Initial download of the metrics may take a while.