Fig. 10.
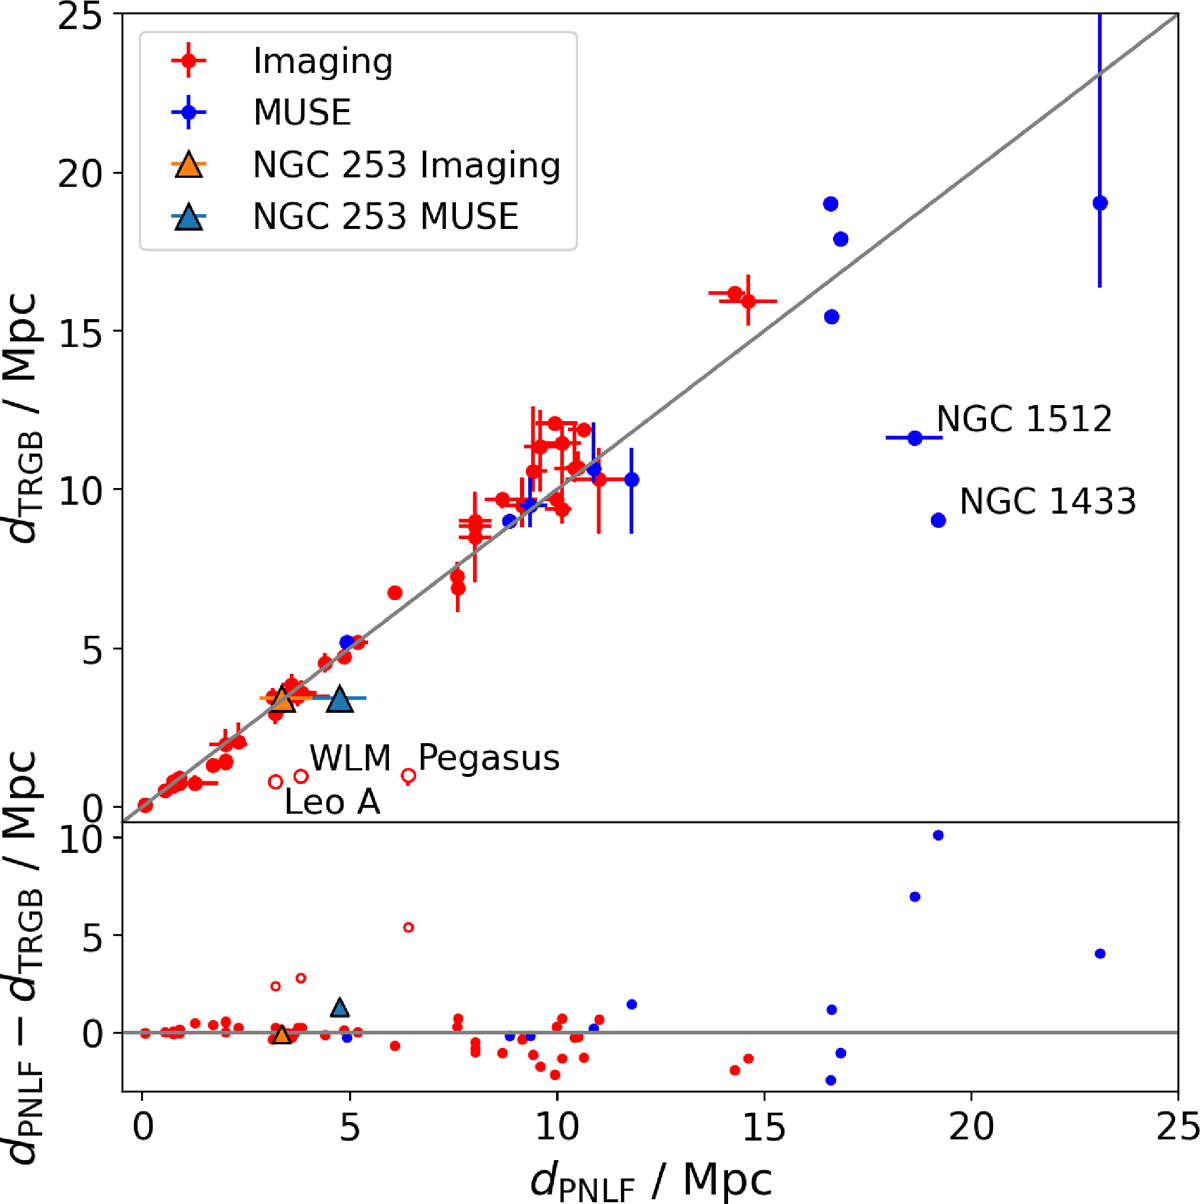
Download original image
Distance comparison for galaxies with PNLF and TRGB measurements from NED. The red points indicate galaxies where the PNLF was measured using imaging techniques, while blue points indicate PNLF measurements obtained with MUSE data. The grey line shows the one-to-one relation. The orange and light blue triangles identify the position of NGC 253 in the diagram when considering only imaging PNLF or MUSE-based PNLF, respectively. Error bars represent the range between the minimum and maximum values obtained via a specific method. We also annotated in the main panel the position of a few notable sources, and we plot Pegasus, Leo A, and WLM with open red circles.
Current usage metrics show cumulative count of Article Views (full-text article views including HTML views, PDF and ePub downloads, according to the available data) and Abstracts Views on Vision4Press platform.
Data correspond to usage on the plateform after 2015. The current usage metrics is available 48-96 hours after online publication and is updated daily on week days.
Initial download of the metrics may take a while.