Fig. 14.
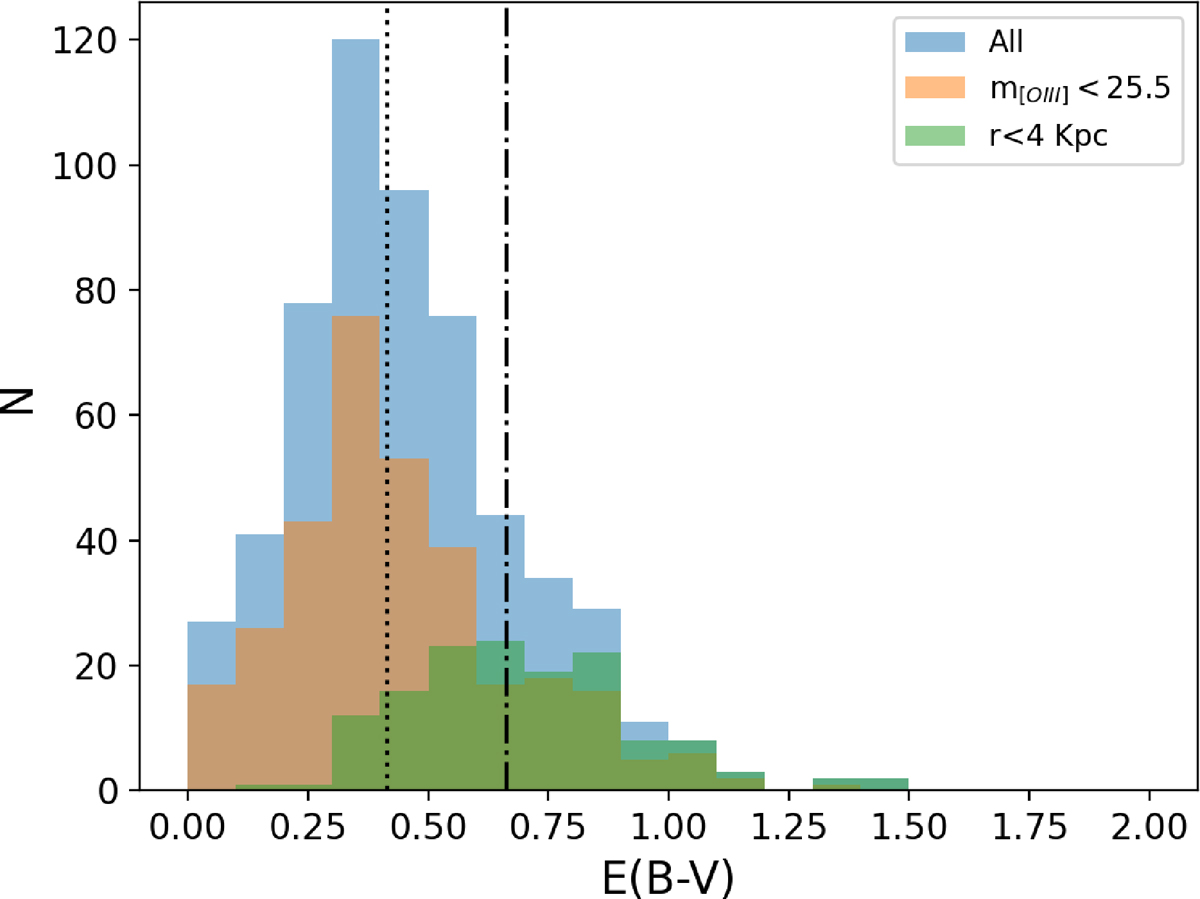
Download original image
Maximum host galaxy E(B−V) associated with each PN. In blue we show the full sample, in orange only the PNe brighter than 25.5 mag, and in green the PNe located within 4 kpc from the centre of the galaxy. The dotted line represents the median E(B−V) for the full sample, while the dashed-dotted line shows the median for PNe in the centre of the galaxy.
Current usage metrics show cumulative count of Article Views (full-text article views including HTML views, PDF and ePub downloads, according to the available data) and Abstracts Views on Vision4Press platform.
Data correspond to usage on the plateform after 2015. The current usage metrics is available 48-96 hours after online publication and is updated daily on week days.
Initial download of the metrics may take a while.